Hello, this is Hao.
I have recently completed my Google data analytics certificate courses, and I chose to move forward with the Cyclistic Bike-Share for my case study. I followed the six steps that was taught in the course (ASK, PREPARE, PROCESS, ANALYZE, SHARE, ACT). Below I will share my thought process on how I processed and what I understood from the given tasks.
COMPANY BACKGROUND
Cyclistic is a bike-share company based in Chicago. The company offers traditional bikes, along with reclining bikes, hand tricycles, and cargo bikes to the people with disabilities and riders who can’t use a standard two-wheeled bike. The majority of riders opt for traditional bikes, about 8% of riders use the assistive options. The bikes can be unlocked from one station and returned to any other station in the system anytime, since they have more than 692 stations across Chicago.
Cyclistic users are more likely to ride for leisure, but about 30% use them to commute to work each day. The company offers 2 types of passes, and the customers who purchase single-ride or full-day passes are referred to as casual rides, customers who purchase annual memberships are Cyclistic members.
BUSINESS TASK
The director of marketing Lily Moreno, believes the company’s future success depends on maximizing the number of annual memberships. My team needs to design marketing strategies aimed at converting casual riders into annual members. We need to understand how annual members and casual riders differ, why casual riders would buy a membership, and how digital media could affect our marketing tactics. Then she will present the findings to the executive team for final approval.
PREPARE THE DATA
I have downloaded the past 12 months data (January 2021 to December 2021) from the given link: Cyclistic Trip Data. According to the case study material, the data has been made available by Motivate International Inc., the license information can be found here.
The data provides information on the starting and ending time and station names, for each ride trip, also indicates the customer types (members or casuals), I can use them to answer the business questions.
Problem with the data:
-
The data has some missing fields, most of them are the start and end stations information, I will need to consult with my manager, but I will remove all the rows with missing fields for my analysis for the time being.
-
I can’t tell if there are any return customers from the given data, since there are no customer identifying fields.
-
There are some trip station names with the word “base”, “repair”, “checking”, I will remove these trips since they don’t provide me with relative insights.
PROCESS AND CLEAN THE DATA
I have made copies of the original data and saved it at a different location for back up, then I loaded the data into RStudio for cleaning and initial analysis.
The reason I those RStudio over Microsoft Excel was simply based on the size of the dataset, since there are well over 1 million rows. The code for data processing and cleaning can be found on Kaggle.
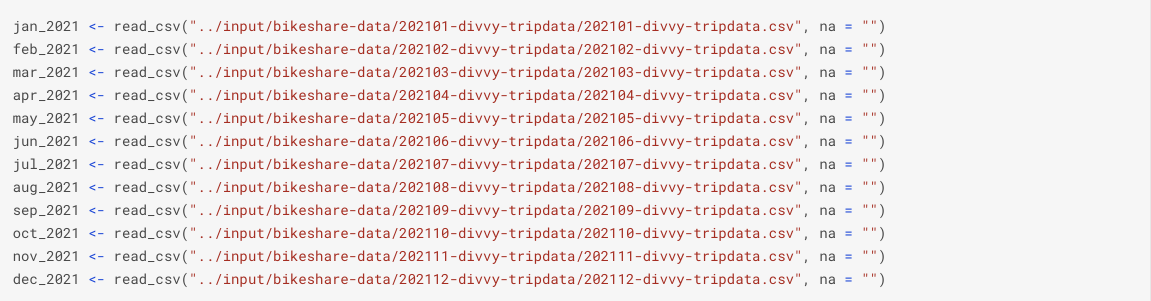
LOAD THE DATA INTO RSTUDIO
After viewing the original data, the first thing I noticed was there are empty fields, so I decided to use read_csv, and its NA argument, so we can work with the NA values at a later time.
Then I ran glimpse function on all the datasets to make sure all of them have the same number of columns, and all the columns are in the same data types across the 12 sets.
I used rbind function to combine all 12 datasets into one, and named it full_trip. After running another glimpse function, the new dataset still has 13 columns, which is consistent with the original datasets, and with more than 5 million rows.

DATA CLEANING
Checked for empty rows and columns, and removed all the rows that contains NA, and named the new dataset full_trip_v1.

I then created time variables such as month, week_day, hour and ride_length using the lubridate functions and also removed any ride trips with the ride_length less than 1 minute, and more than 1440 minutes, which is more than 24 hours. Renamed the new dataset full_trip_time.

Removed all the ride trips which the bikes were taken in for maintenance and repair, renamed full_trip_cleaned. Finally checked to see if there are any rows with the duplicate ride_id.

ANALYZE
Some initial calculations and plotting using ggplot2 functions were done in RStudio before moving to Tableau for data visualization.
-
Average time per ride between members and casual riders.
-
Numbers of riders and the total ride time between members and casual riders on different hour, weekday, and months.
Data visualization done in Tableau
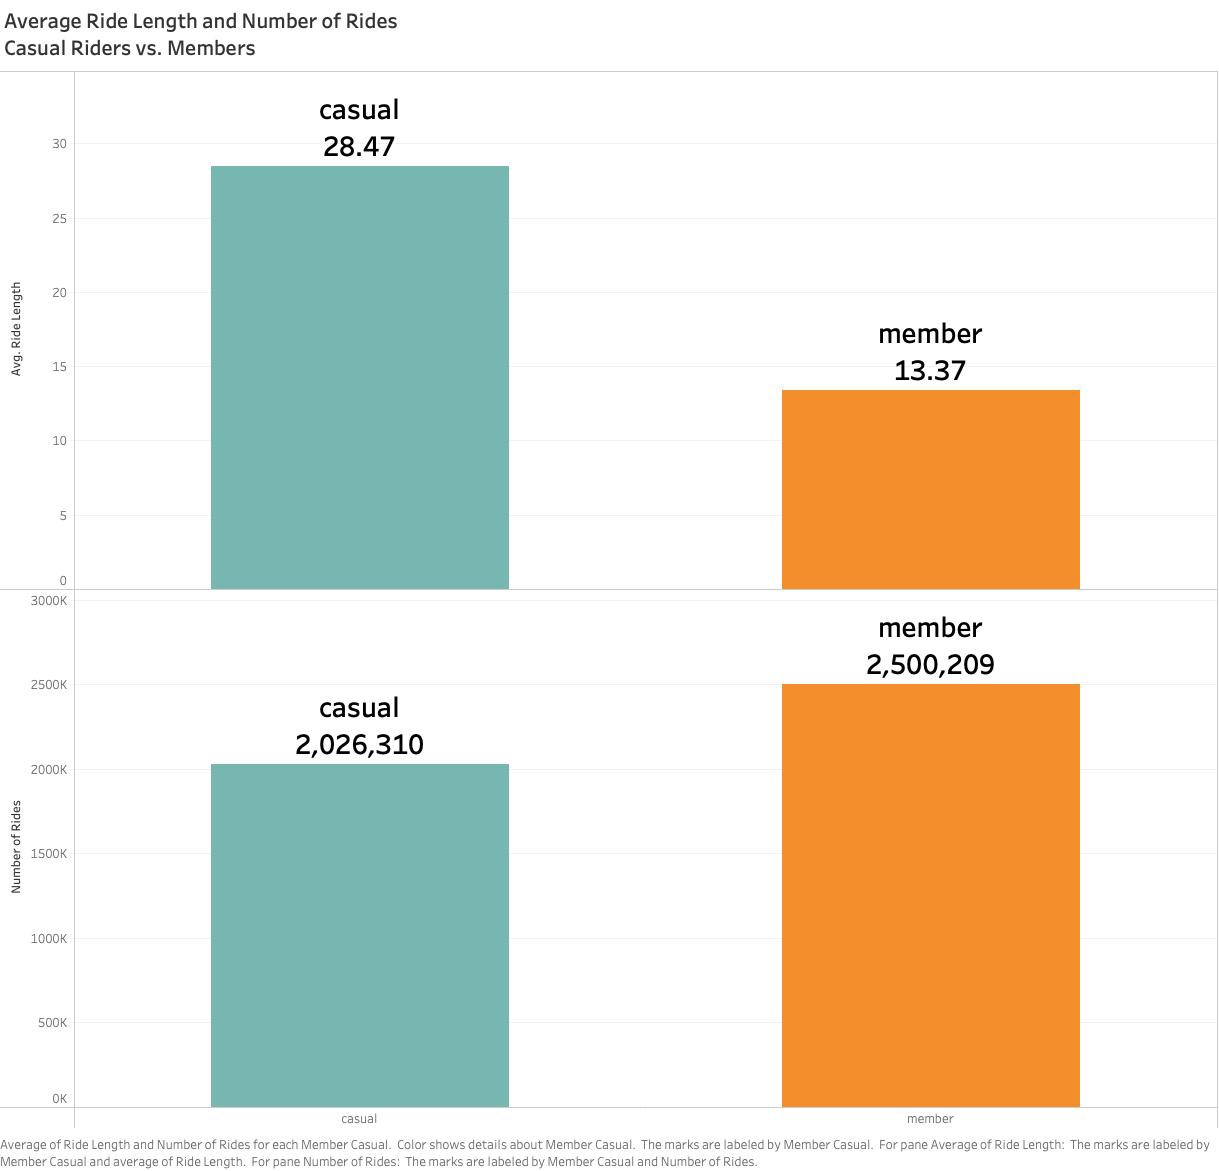
The number of bike rides for members is around 2.5 million trips, and around 2 millions for the casual riders. But the average ride trip length for casual riders is 28.47 minutes, and average trip length for member is 13.37 minutes. Casual riders spend more than double the time of members. (figure below)
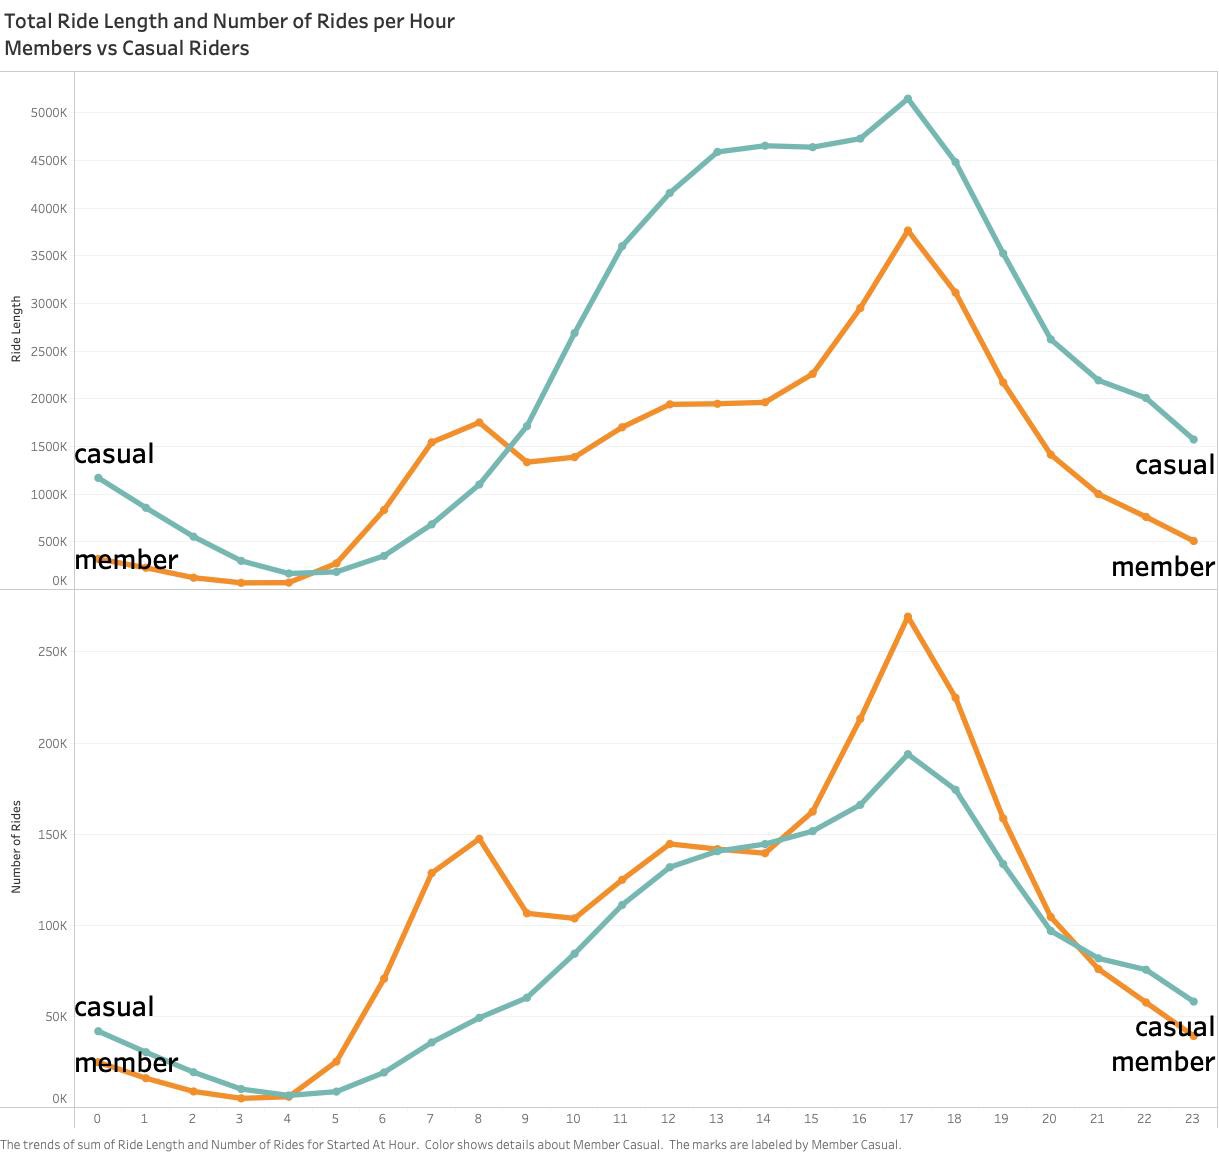
Throughout the day, the ride length for the members peaks around 8 am and 5 pm, this is consistent with the commute hours for work. the ride length for casual riders increases over the hours and peaks around 5 pm as well. So there might be a potential limited number of bikes available around this time. (figure below)
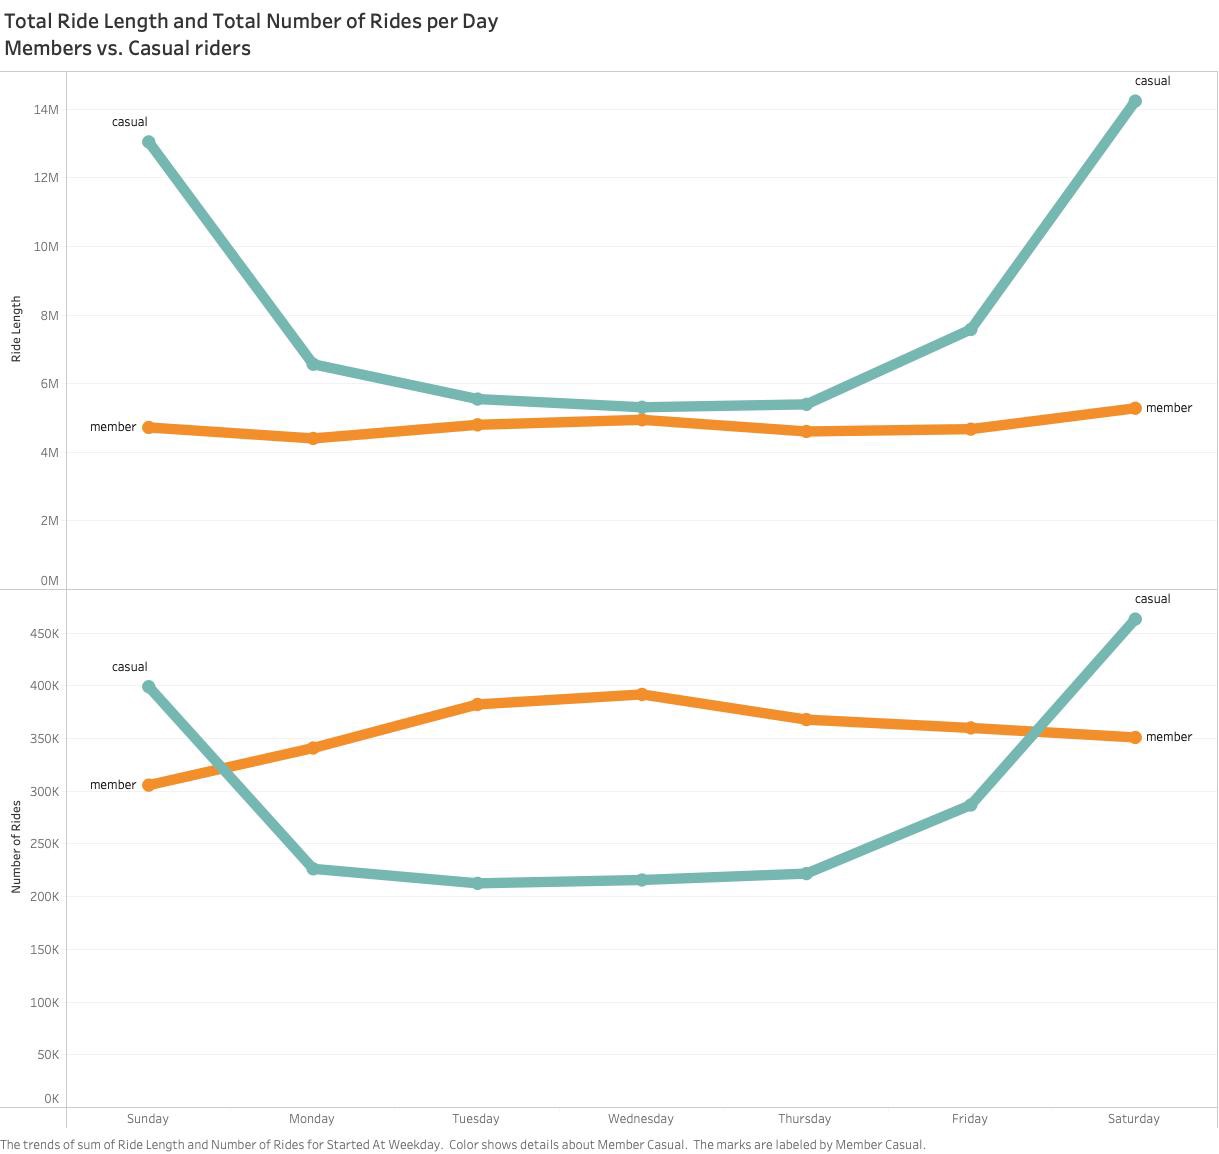
The number of rides and total ride time are pretty consistent for members throughout the week days, but both numbers are peaking at the weekends for casual riders. (figure below)
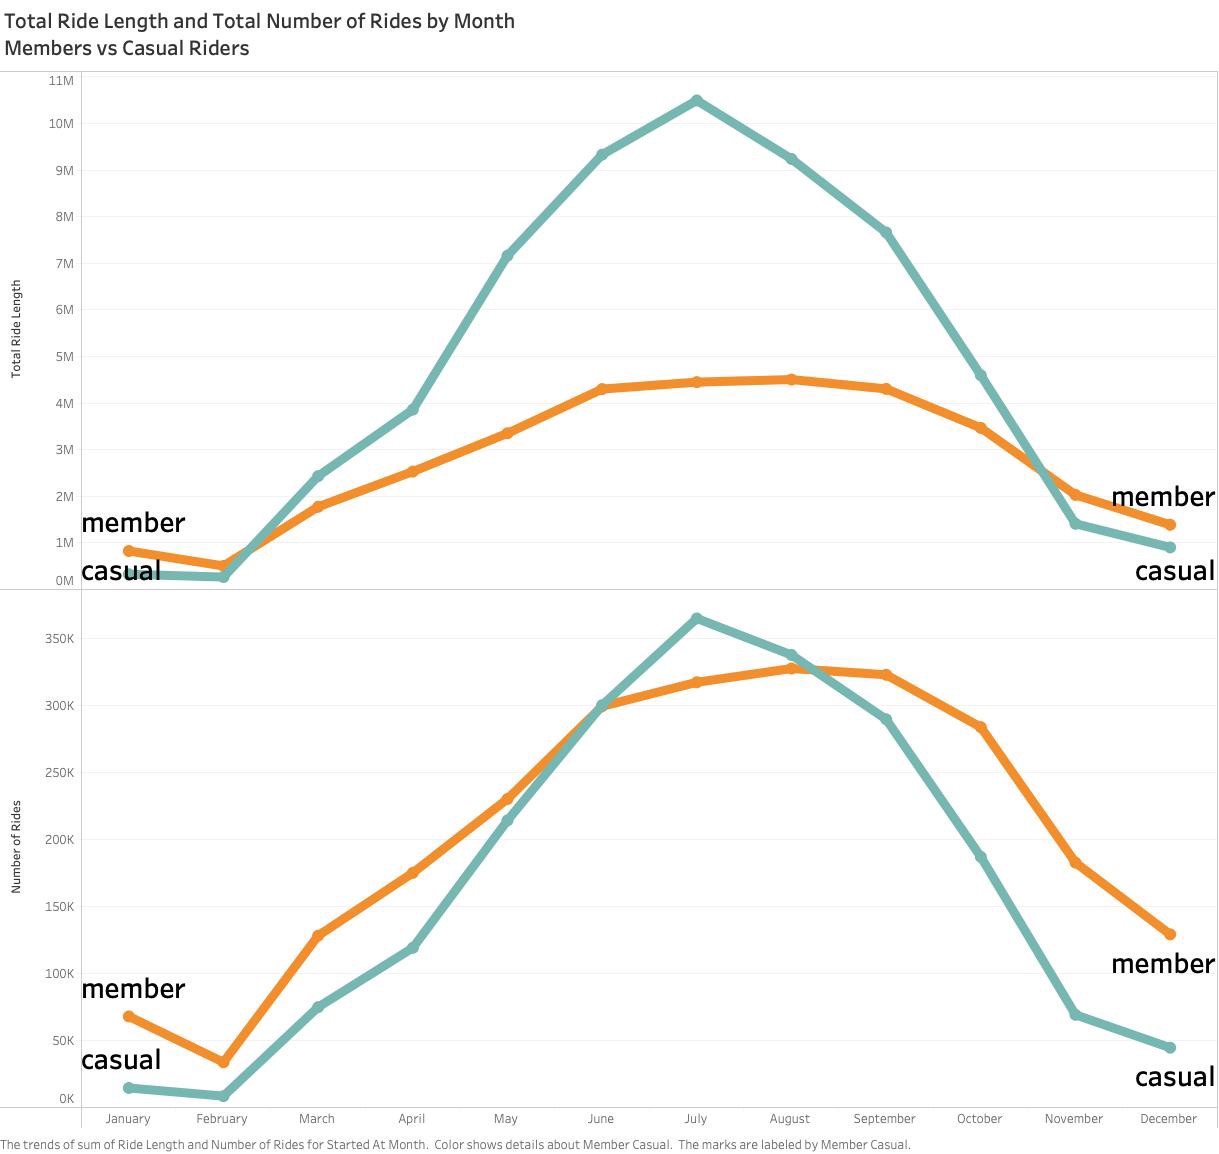
Both members and casual riders have the lowest interests during the cold weather (November — February) in Chicago area. Both hit the peaks during the summer months (June — September). (figure below)
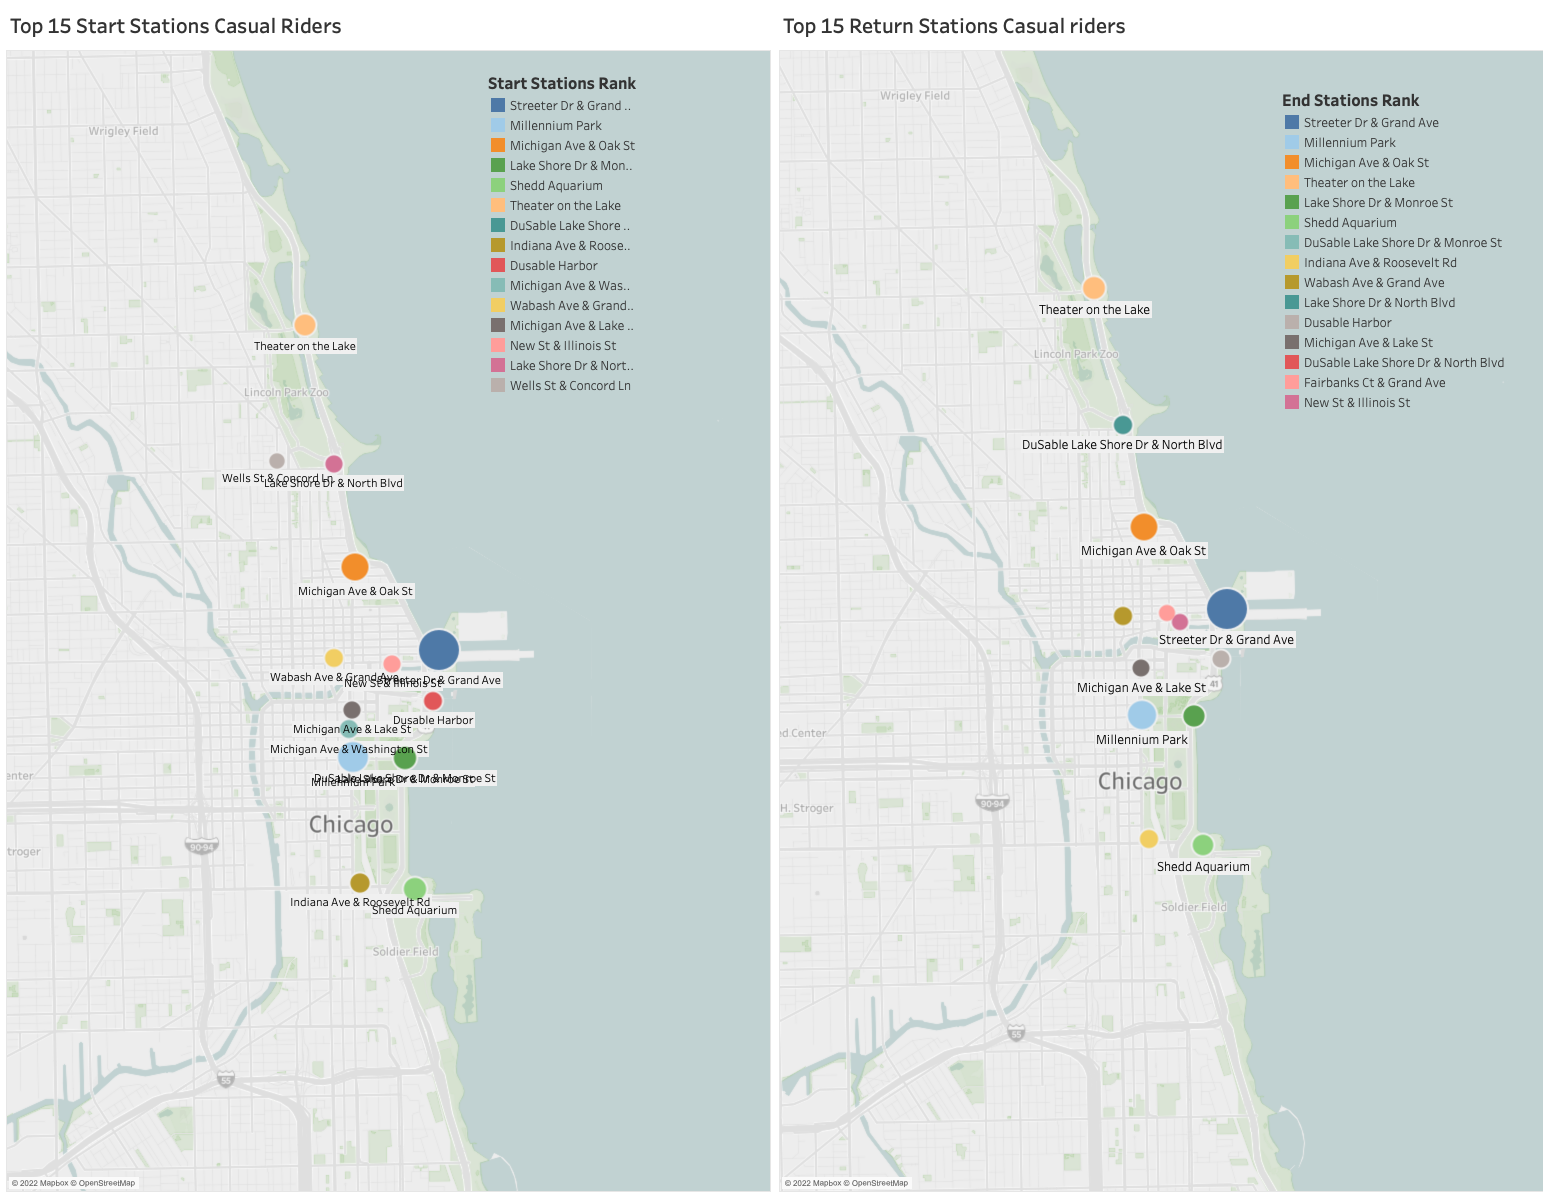
The top 15 most popular start and return stations for casual riders shows riders like to spend time along the coast lines, parks, and aquarium. (figure below)
For interactive dashboards, please click Tableau.
ACT
Conclusion:
The casual riders likes to use the bikes over the weekends, and along the coastlines and sightseeing sites, comparing members ride times are more consistent during the weekdays. But both casual and membership riders like to use bikes around 5 pm, that means some casual riders also use bikes to commute from work.
Recommendations:
- The marketing team should target the top 15 stations, over the weekend, during the warm seasons to get the best result on the resources.
- Membership priorities could also be provided as there might be limited bikes availabilities during peak hours.
- Create a customer loyalty program for the casual riders, offer certain discount when sign up for annual membership.
Next steps:
Since the original data couldn’t identify if there are any returned casual riders, a unique customer identifier is definitely recommended. That should be another area the marketing team can focus on.
Thank you for taking your time to read my case study, please leave comments to let me know what you think and how I can improve, cheers!