Hello, this is Hao.
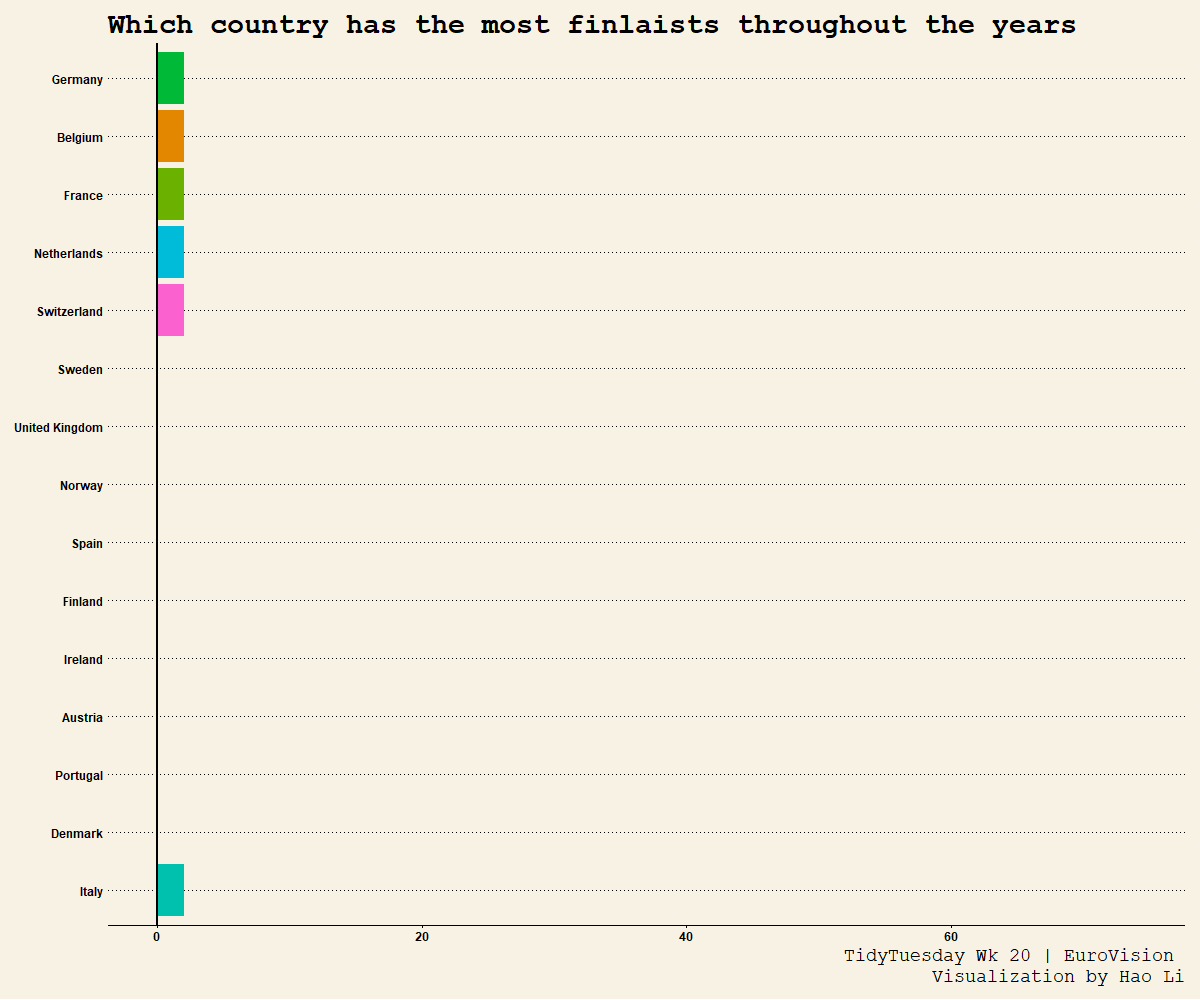
For this week’s TidyTuesday dataset, we are looking at the EuroVision singing contest for the past 80 years. I want to see what countries have the most finalists.
library(tidytuesdayR)
library(tidyverse)
library(ggthemes)
library(gganimate)
library(gifski)
theme_set(theme_wsj())
Load in the data sets
rm(list = ls())
tuesdata <- tidytuesdayR::tt_load('2022-05-17')
eurovision <- tuesdata$eurovision
eurovision_votes <- tuesdata$`eurovision-votes`
# create a data frame for the number of finalists for each country each year
finalists <- eurovision %>%
  group_by(artist_country, year) %>%
  summarise(total_artists = n())

# extract the top 15 country names
top_15_country <- finalists %>%
  group_by(artist_country) %>%
  summarise(total = n()) %>%
  top_n(15) %>%
  select(artist_country)

# extract the finalists info for the top 15 countries
euro_15 <- finalists %>%
  inner_join(top_15_country, by = "artist_country") %>%
  arrange(year, desc(total_artists))


euro_15 %>%
  group_by(artist_country) %>%
  summarise(total = n()) %>%
  arrange(desc(total))

# create a new column for the cumulative sum
euro_15_cum <- euro_15%>%
  mutate(cum_total = cumsum(total_artists))

# plot the animated chart using
chart <- euro_15_cum %>%
  ggplot(aes(reorder(artist_country, cum_total), cum_total, fill = artist_country)) +
  geom_bar(stat = "identity",
           position = "identity",
           show.legend = F) +
  coord_flip()+
  geom_hline(yintercept = 0, size = 1)+
  labs(title = "Which country has the most finlaists throughout the years",

       x = "",
       y = "Total number of finalists",
       caption = "TidyTuesday Wk 20 | EuroVision \nVisualization by Hao Li") +
  transition_reveal(year)


# save the gif
animate(chart, nframes = 180, fps = 18, width = 1200, height = 1000,
  renderer = gifski_renderer("C:/Users/haoli/Desktop/euro_15.gif"))