Hello, this is Hao.
On May 17th 2022, the coronavirus has taken more than 1 million lives in the United States alone, you can read this article from NPR here. I wanted to see what we have learned about the virus and how it’s affecting different countries in the world, so I downloaded the data set from ourworldindata’s github page.
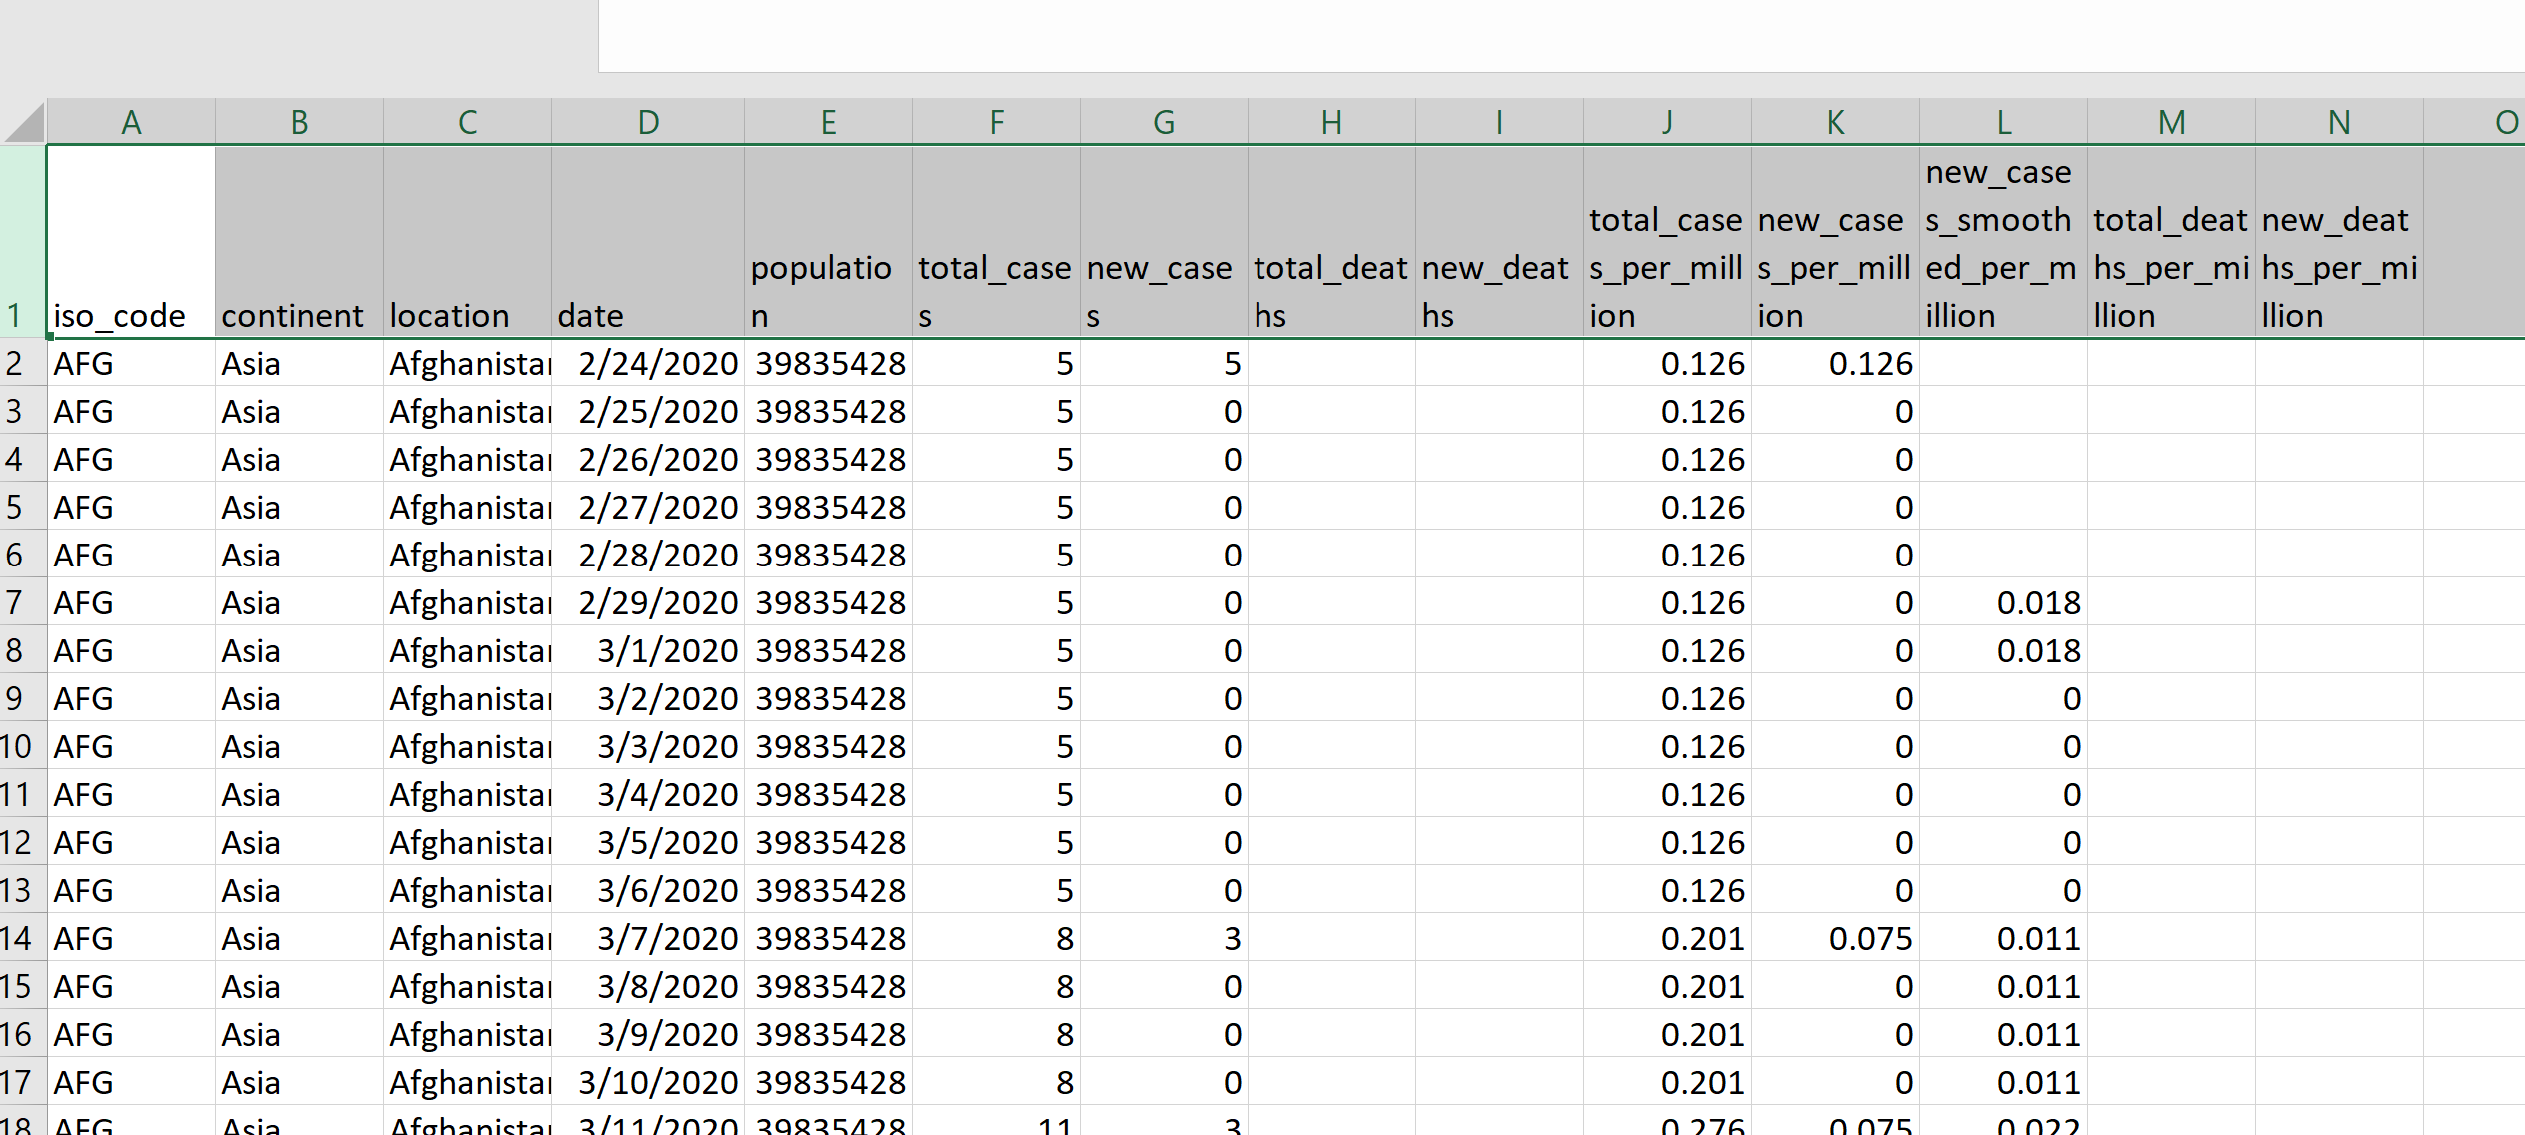
The data has more than 188 thousand rows and more than 60 columns, I decided to break it into 3 smaller sets and drop some columns that I don’t need for the analysis today.
I broke the data set down into covid_cases;
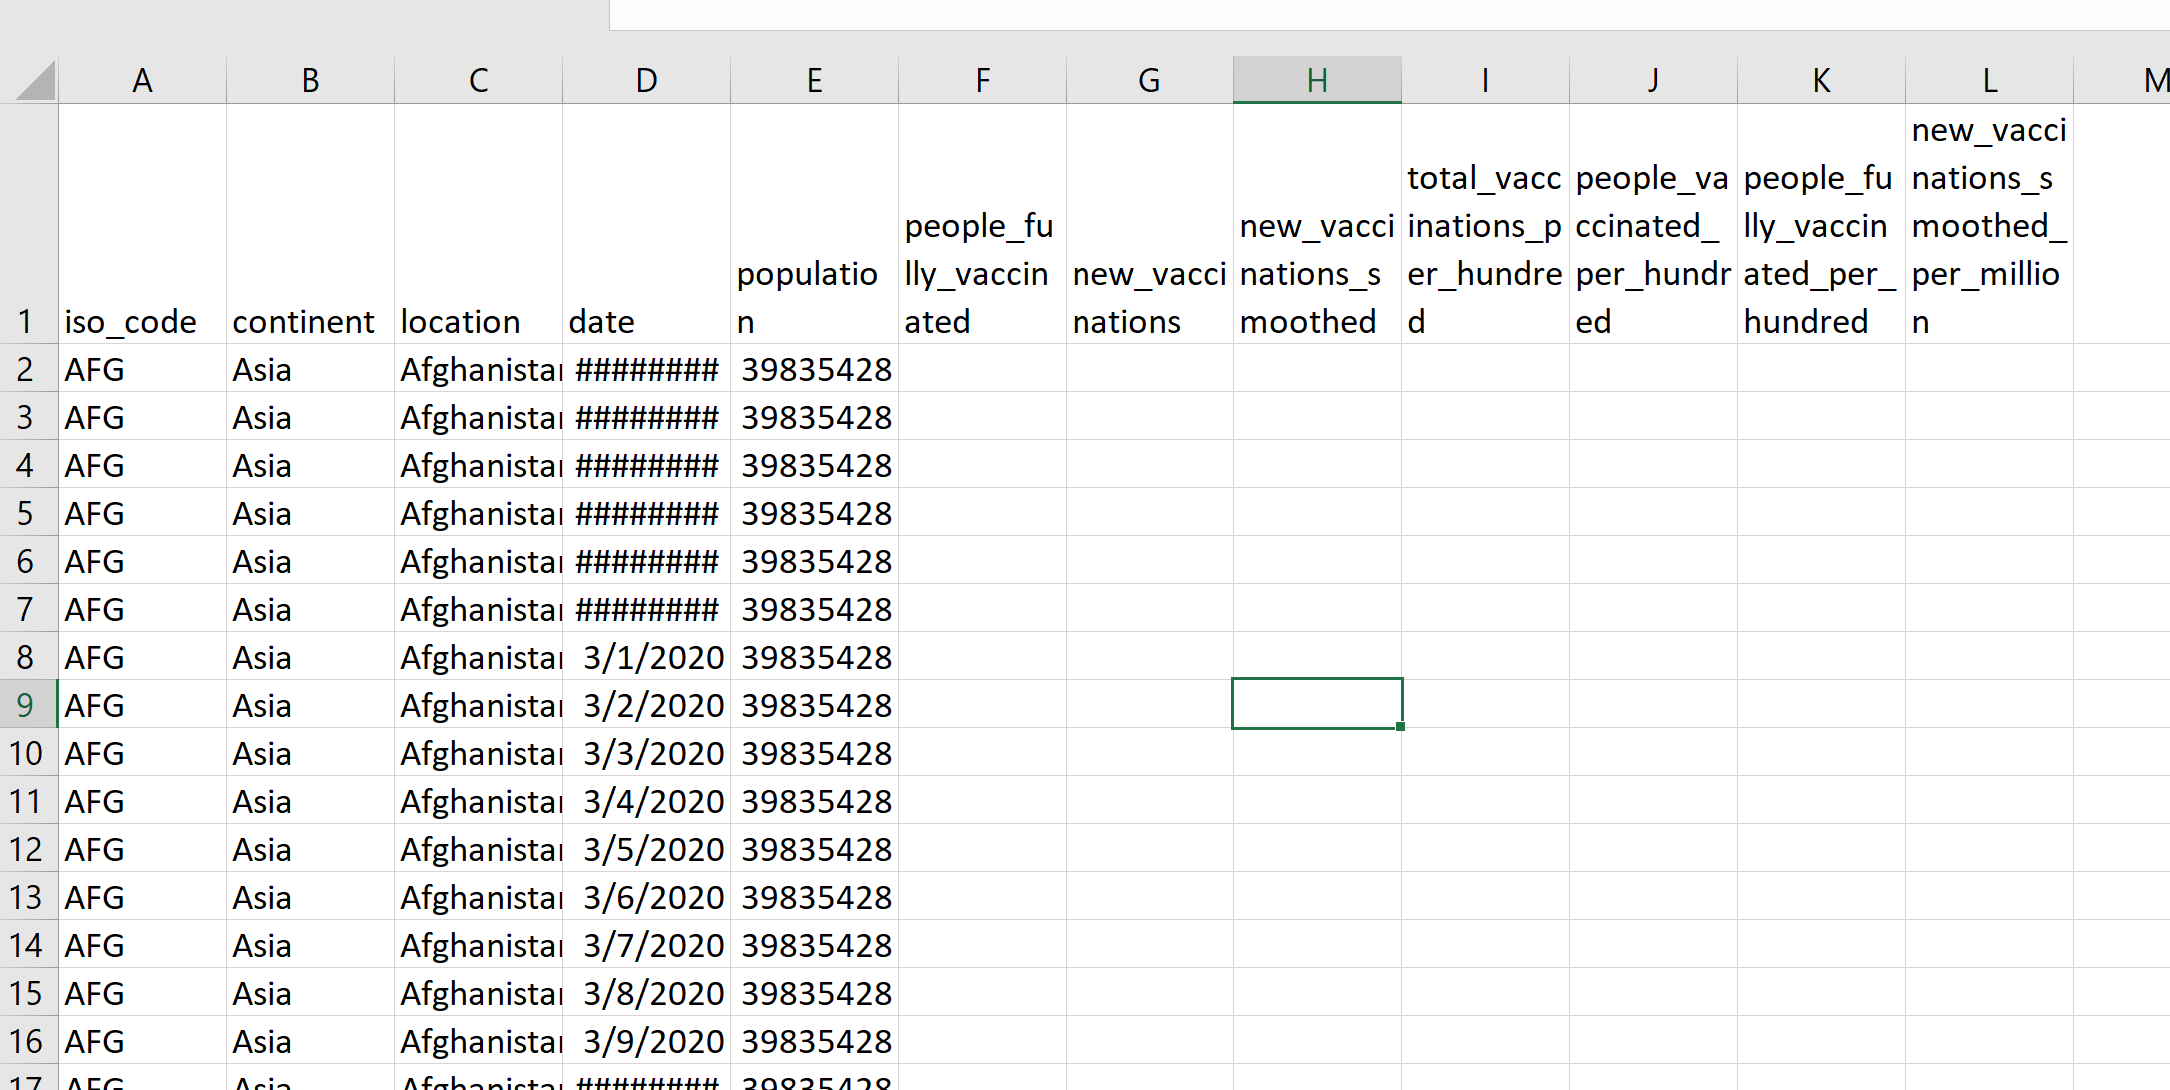
covid_vaccinations;
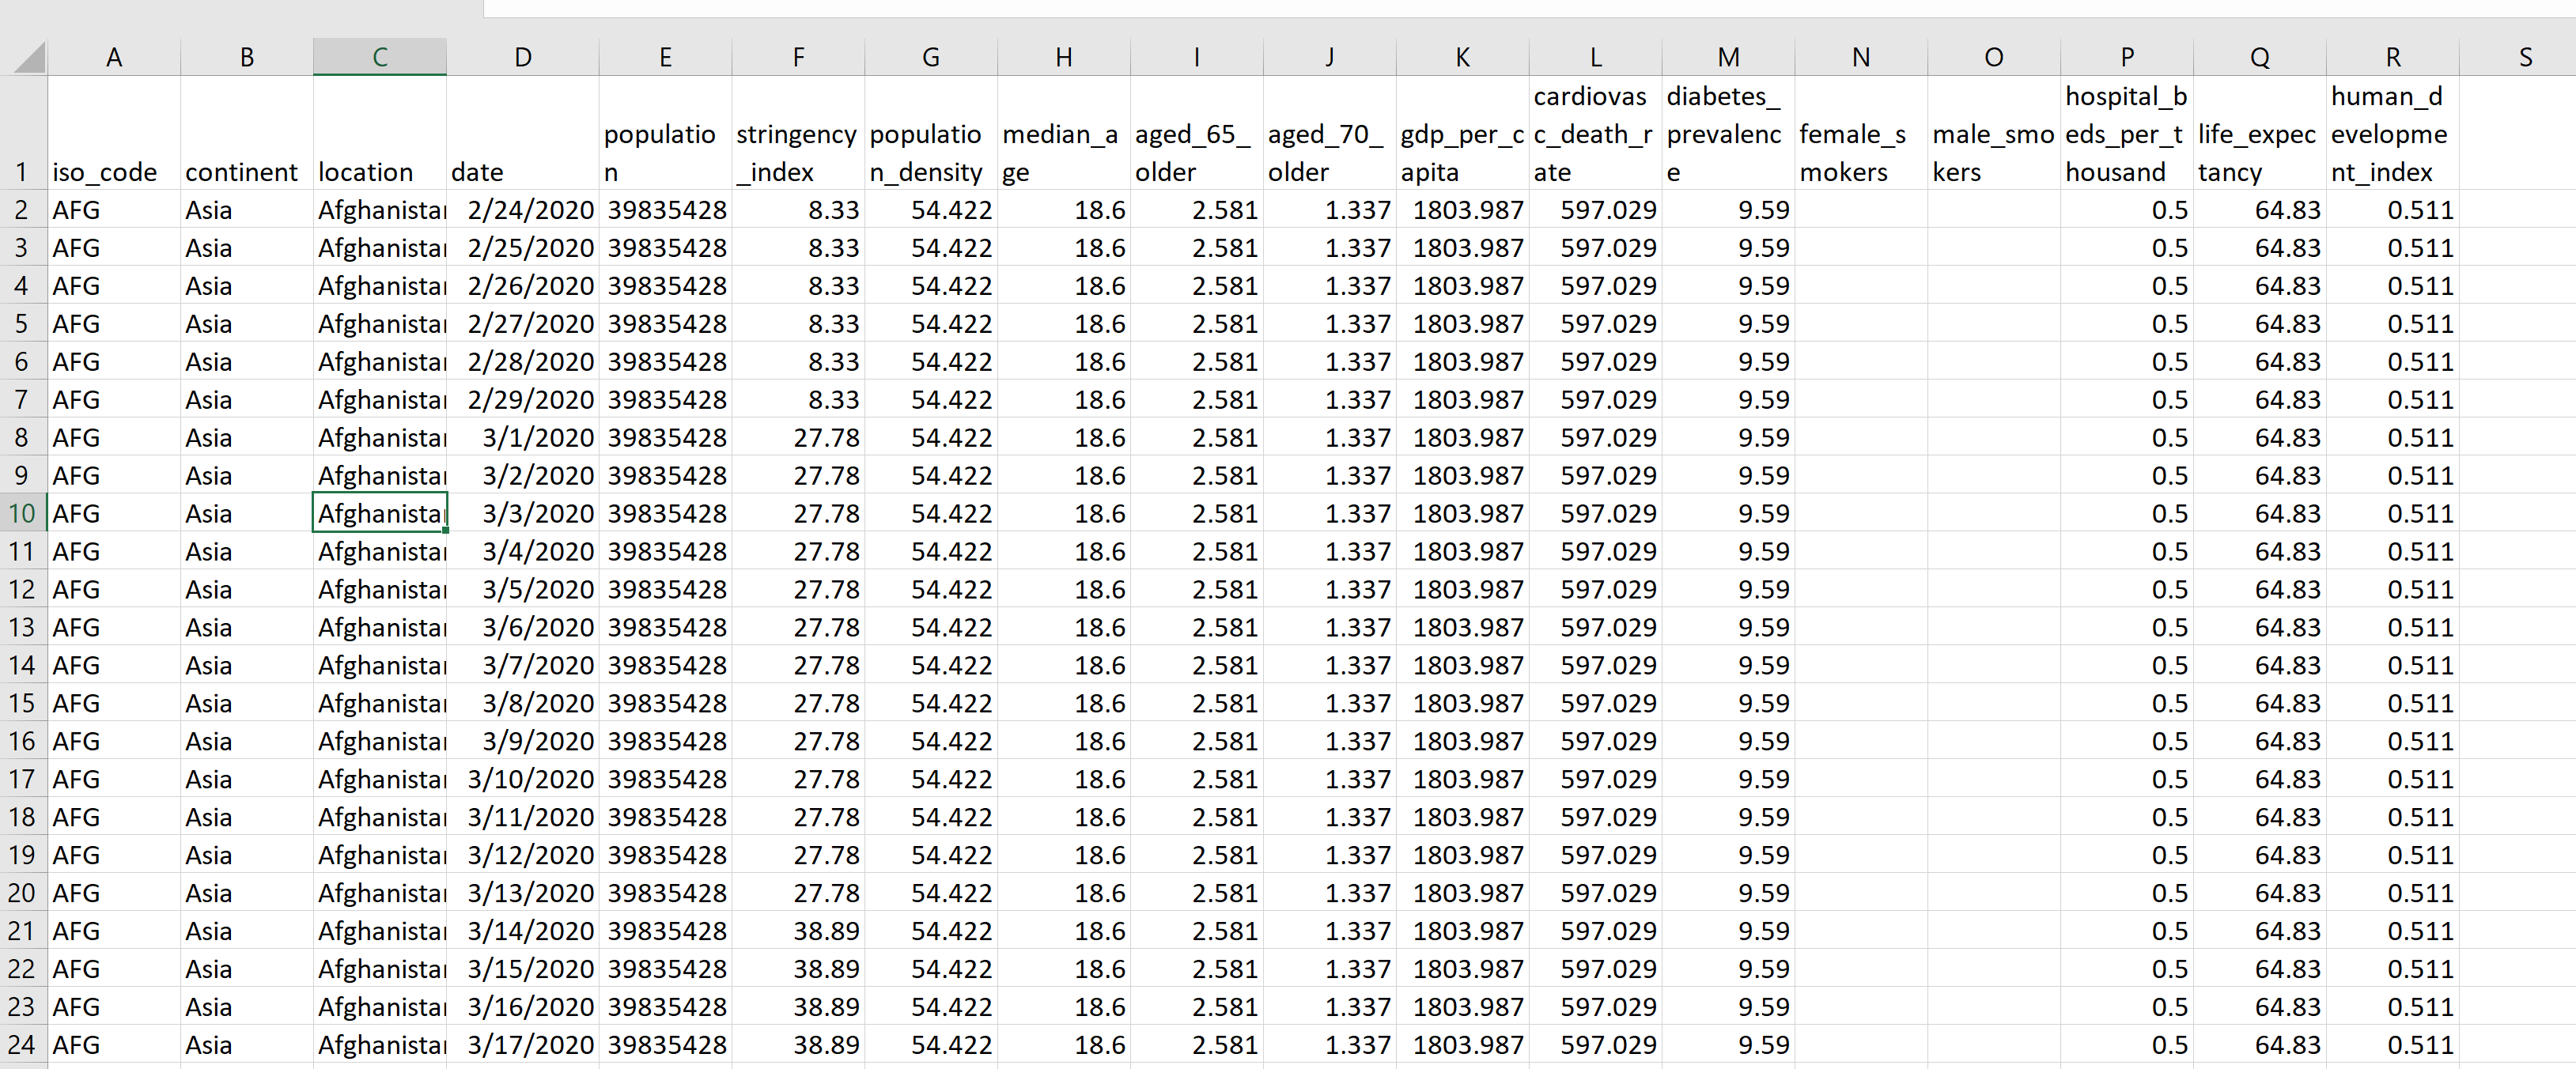
and countries.
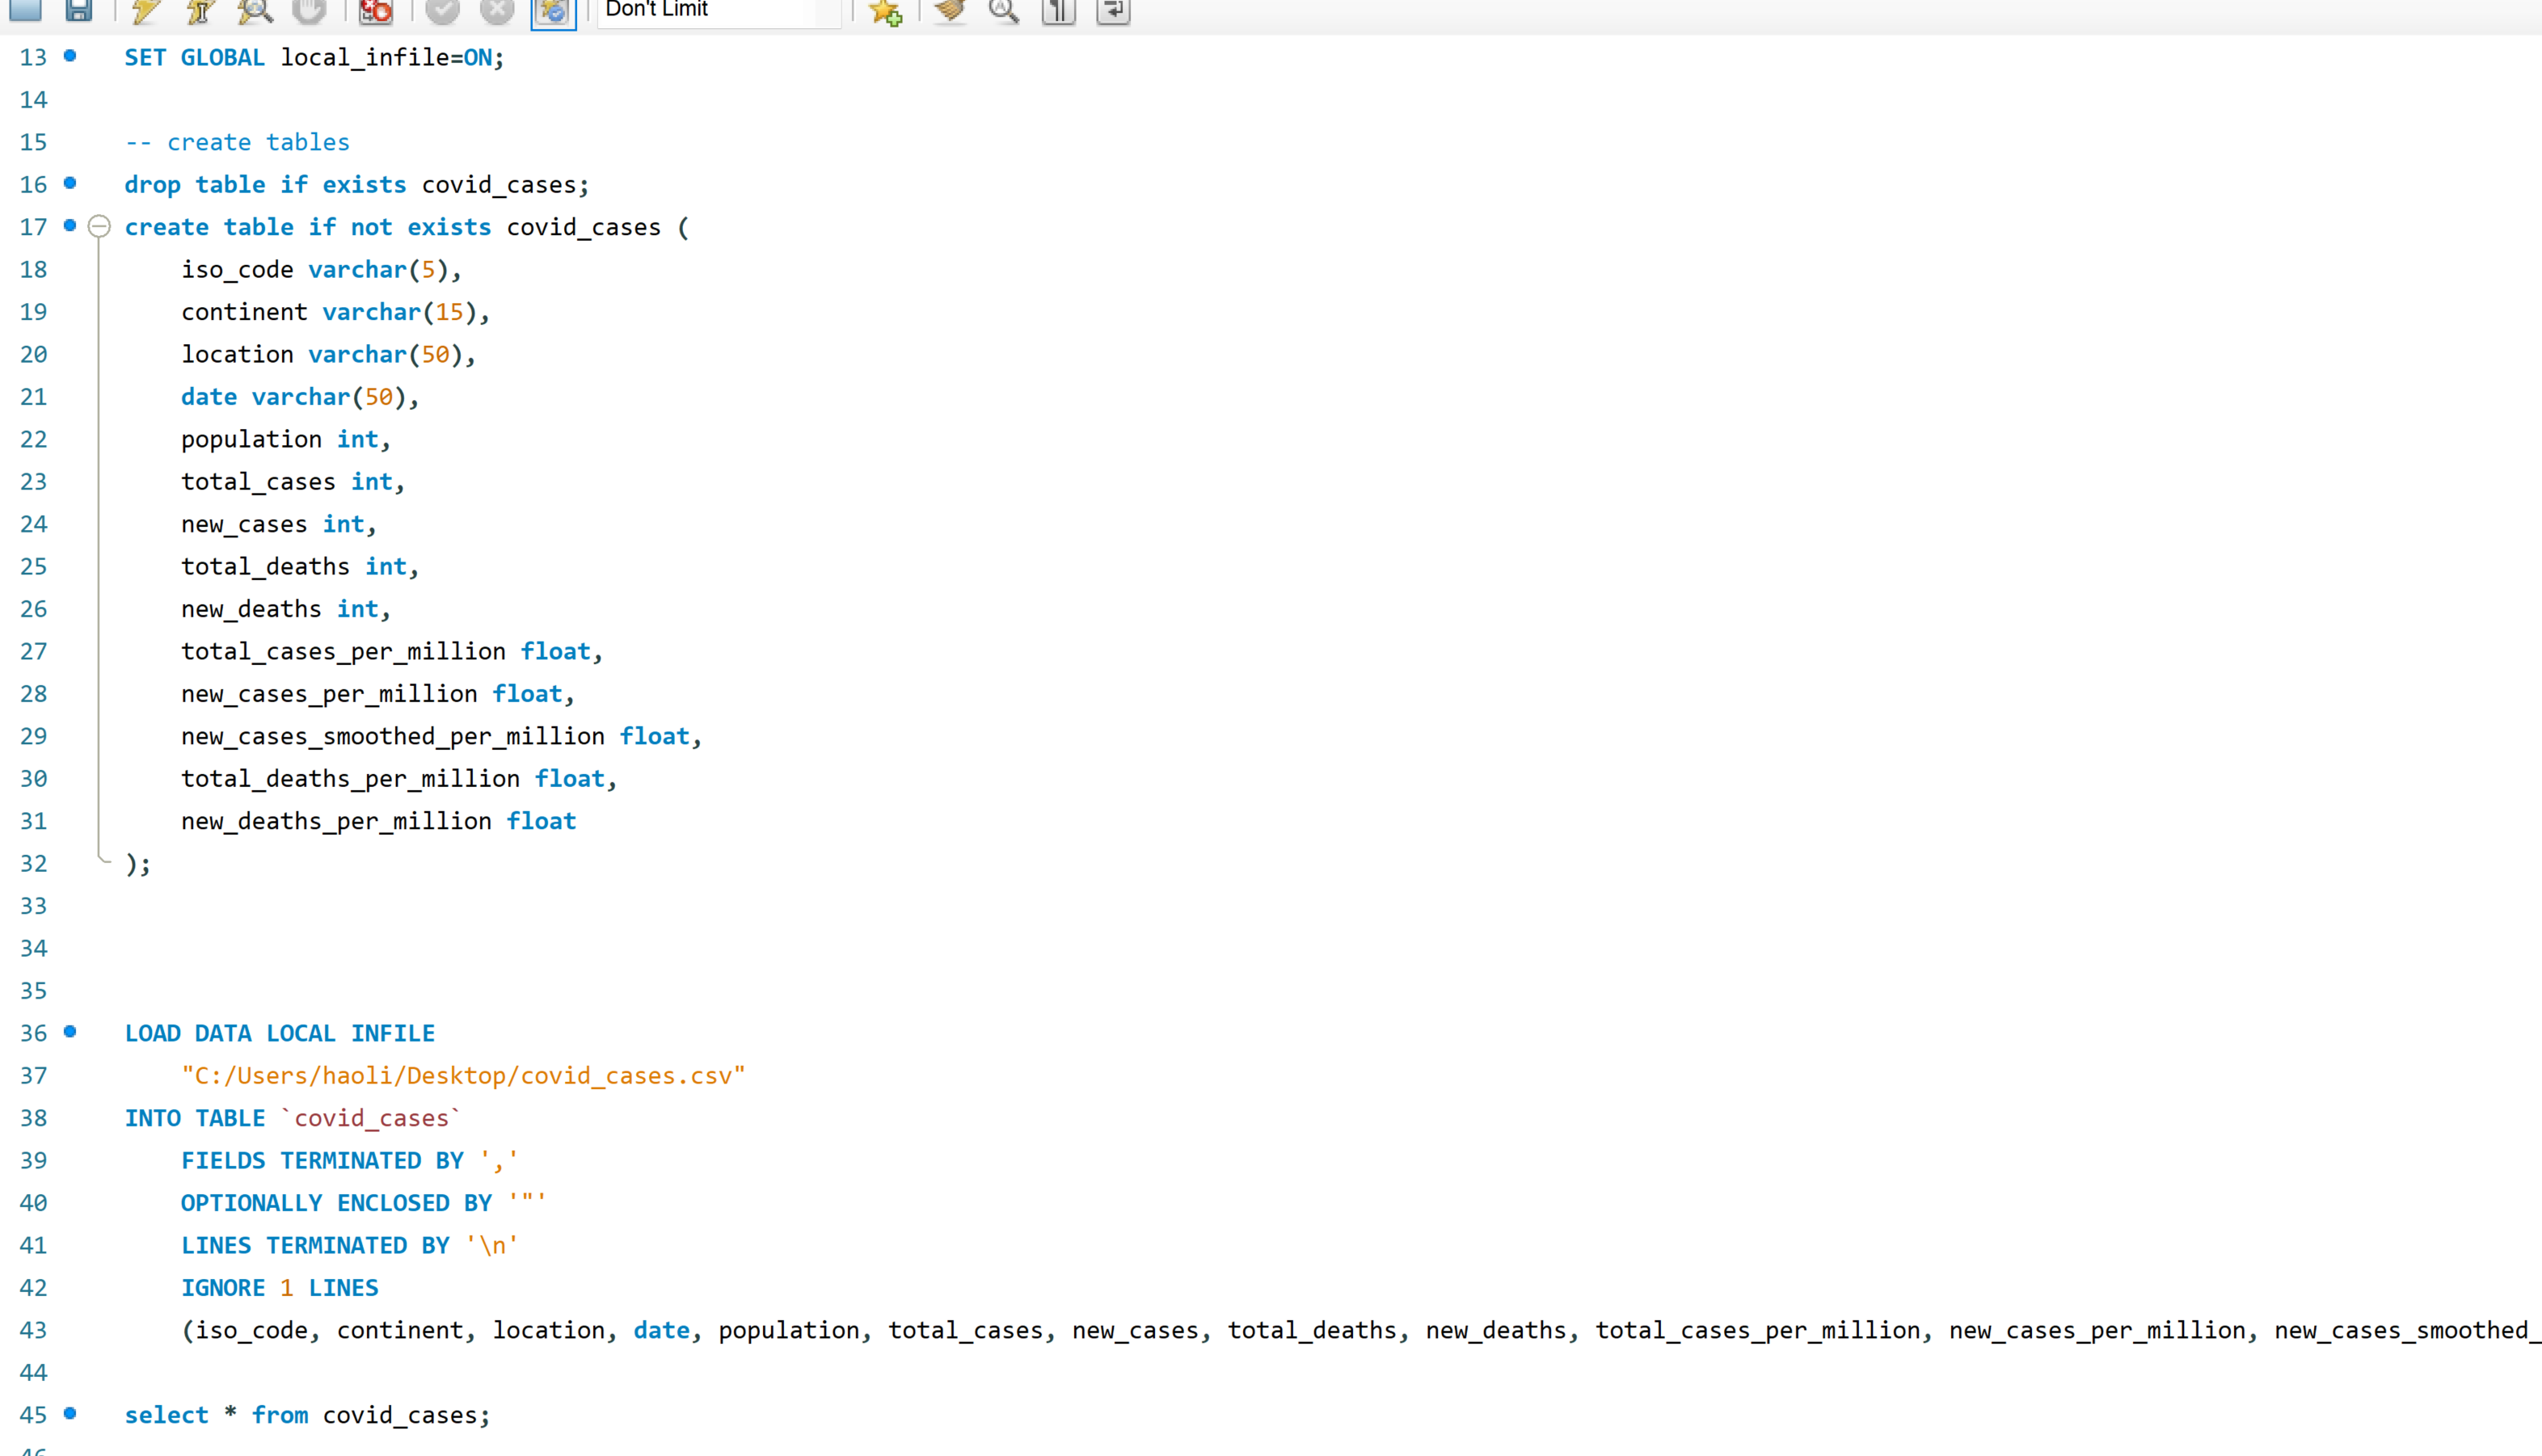
Then I used LOAD DATA LOCAL INFILE to load the 3 data sets into my new database
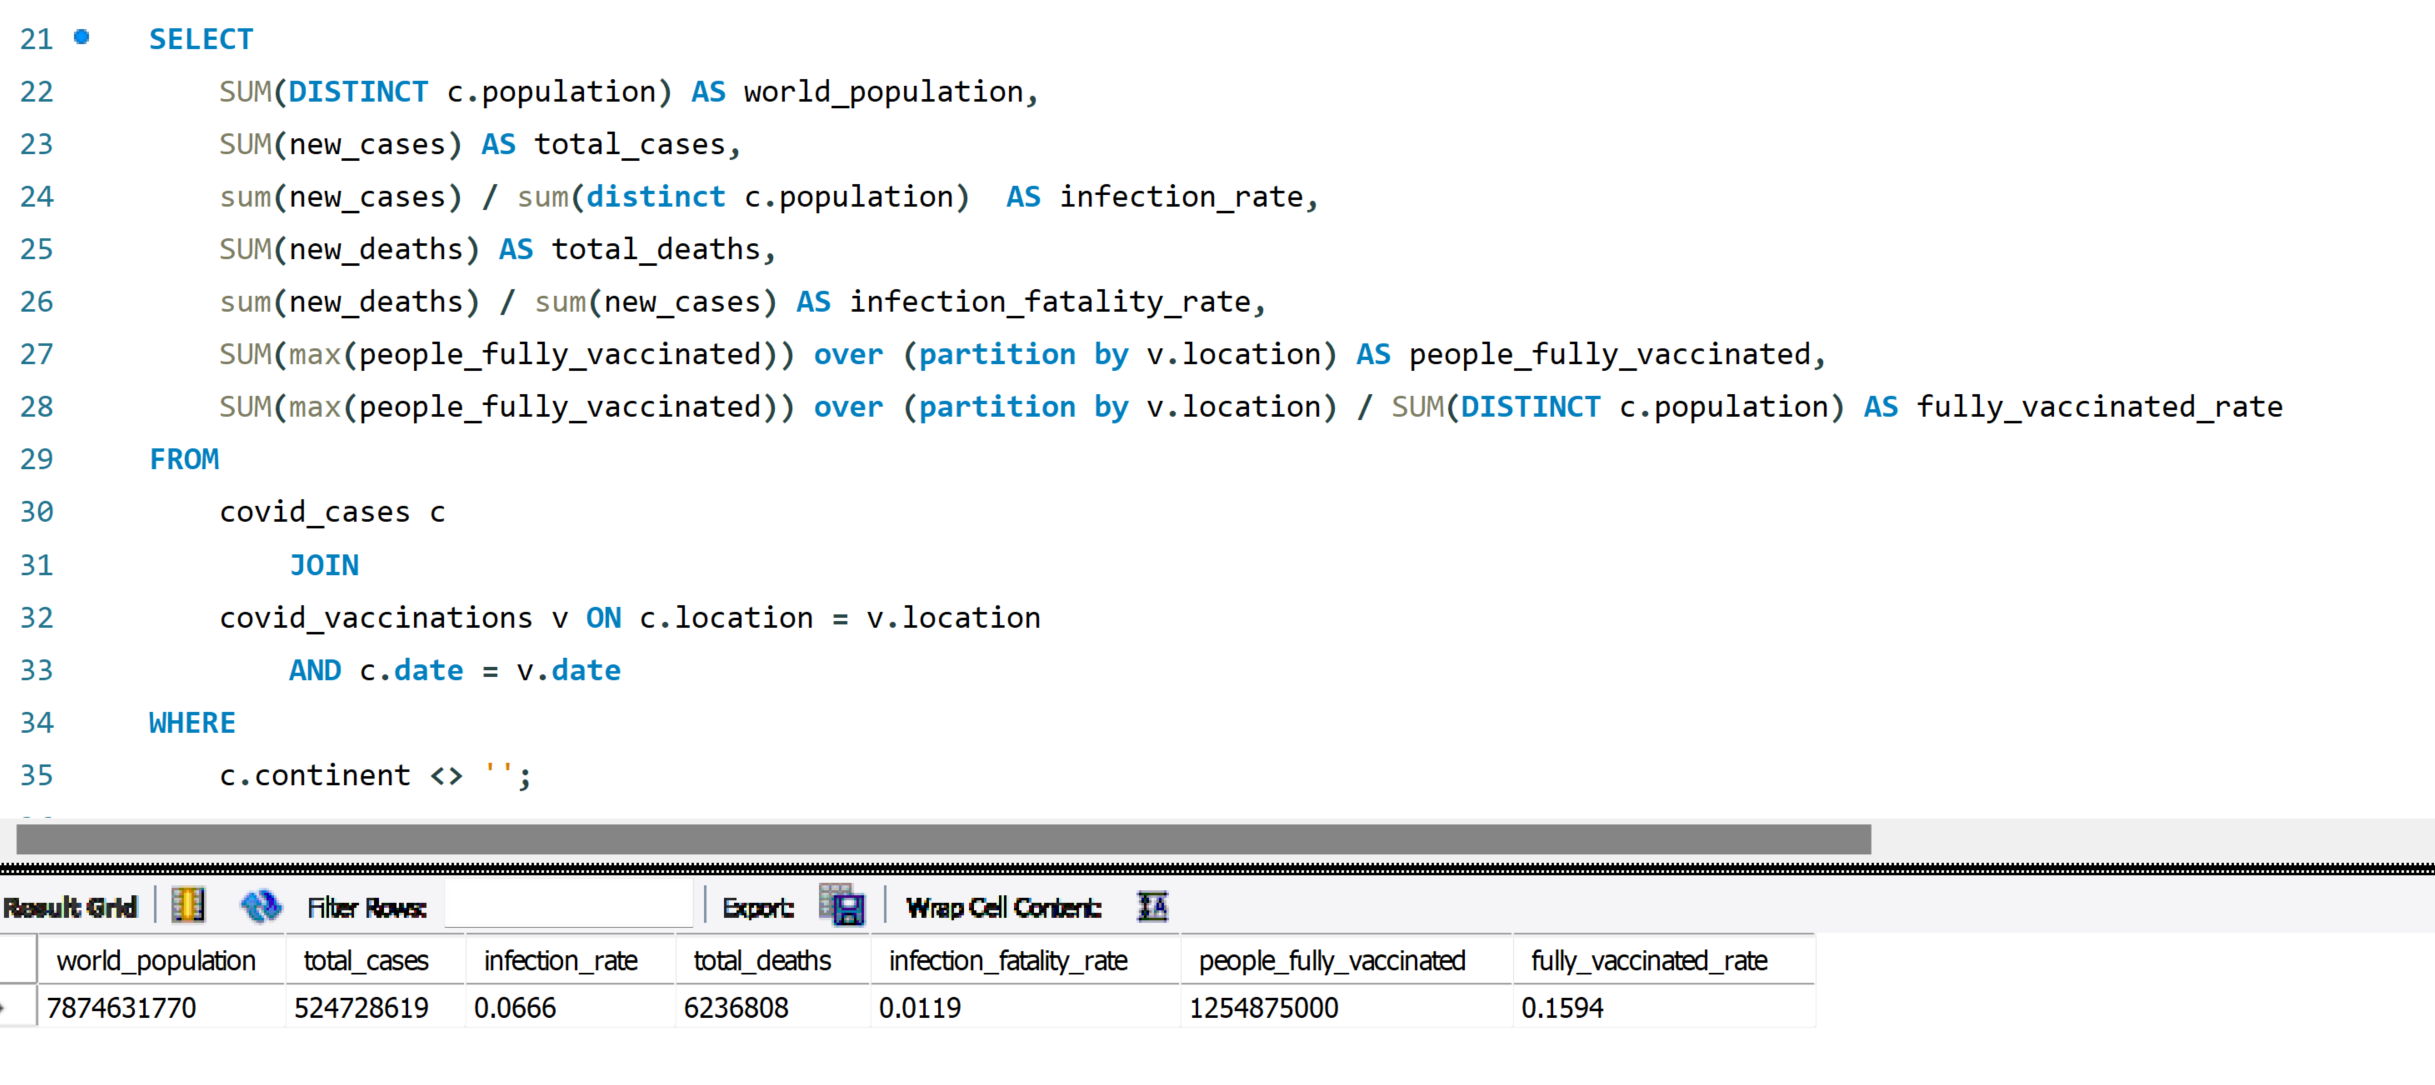
After verifying all the tables, I want to look at some key numbers from the global view. Infection rate is the confirmed cases in total population, infection fatality rate is the total death number in the total confirmed cases, and fully vaccinated rate is the people who received at least 2 vaccine shots over the entire population.
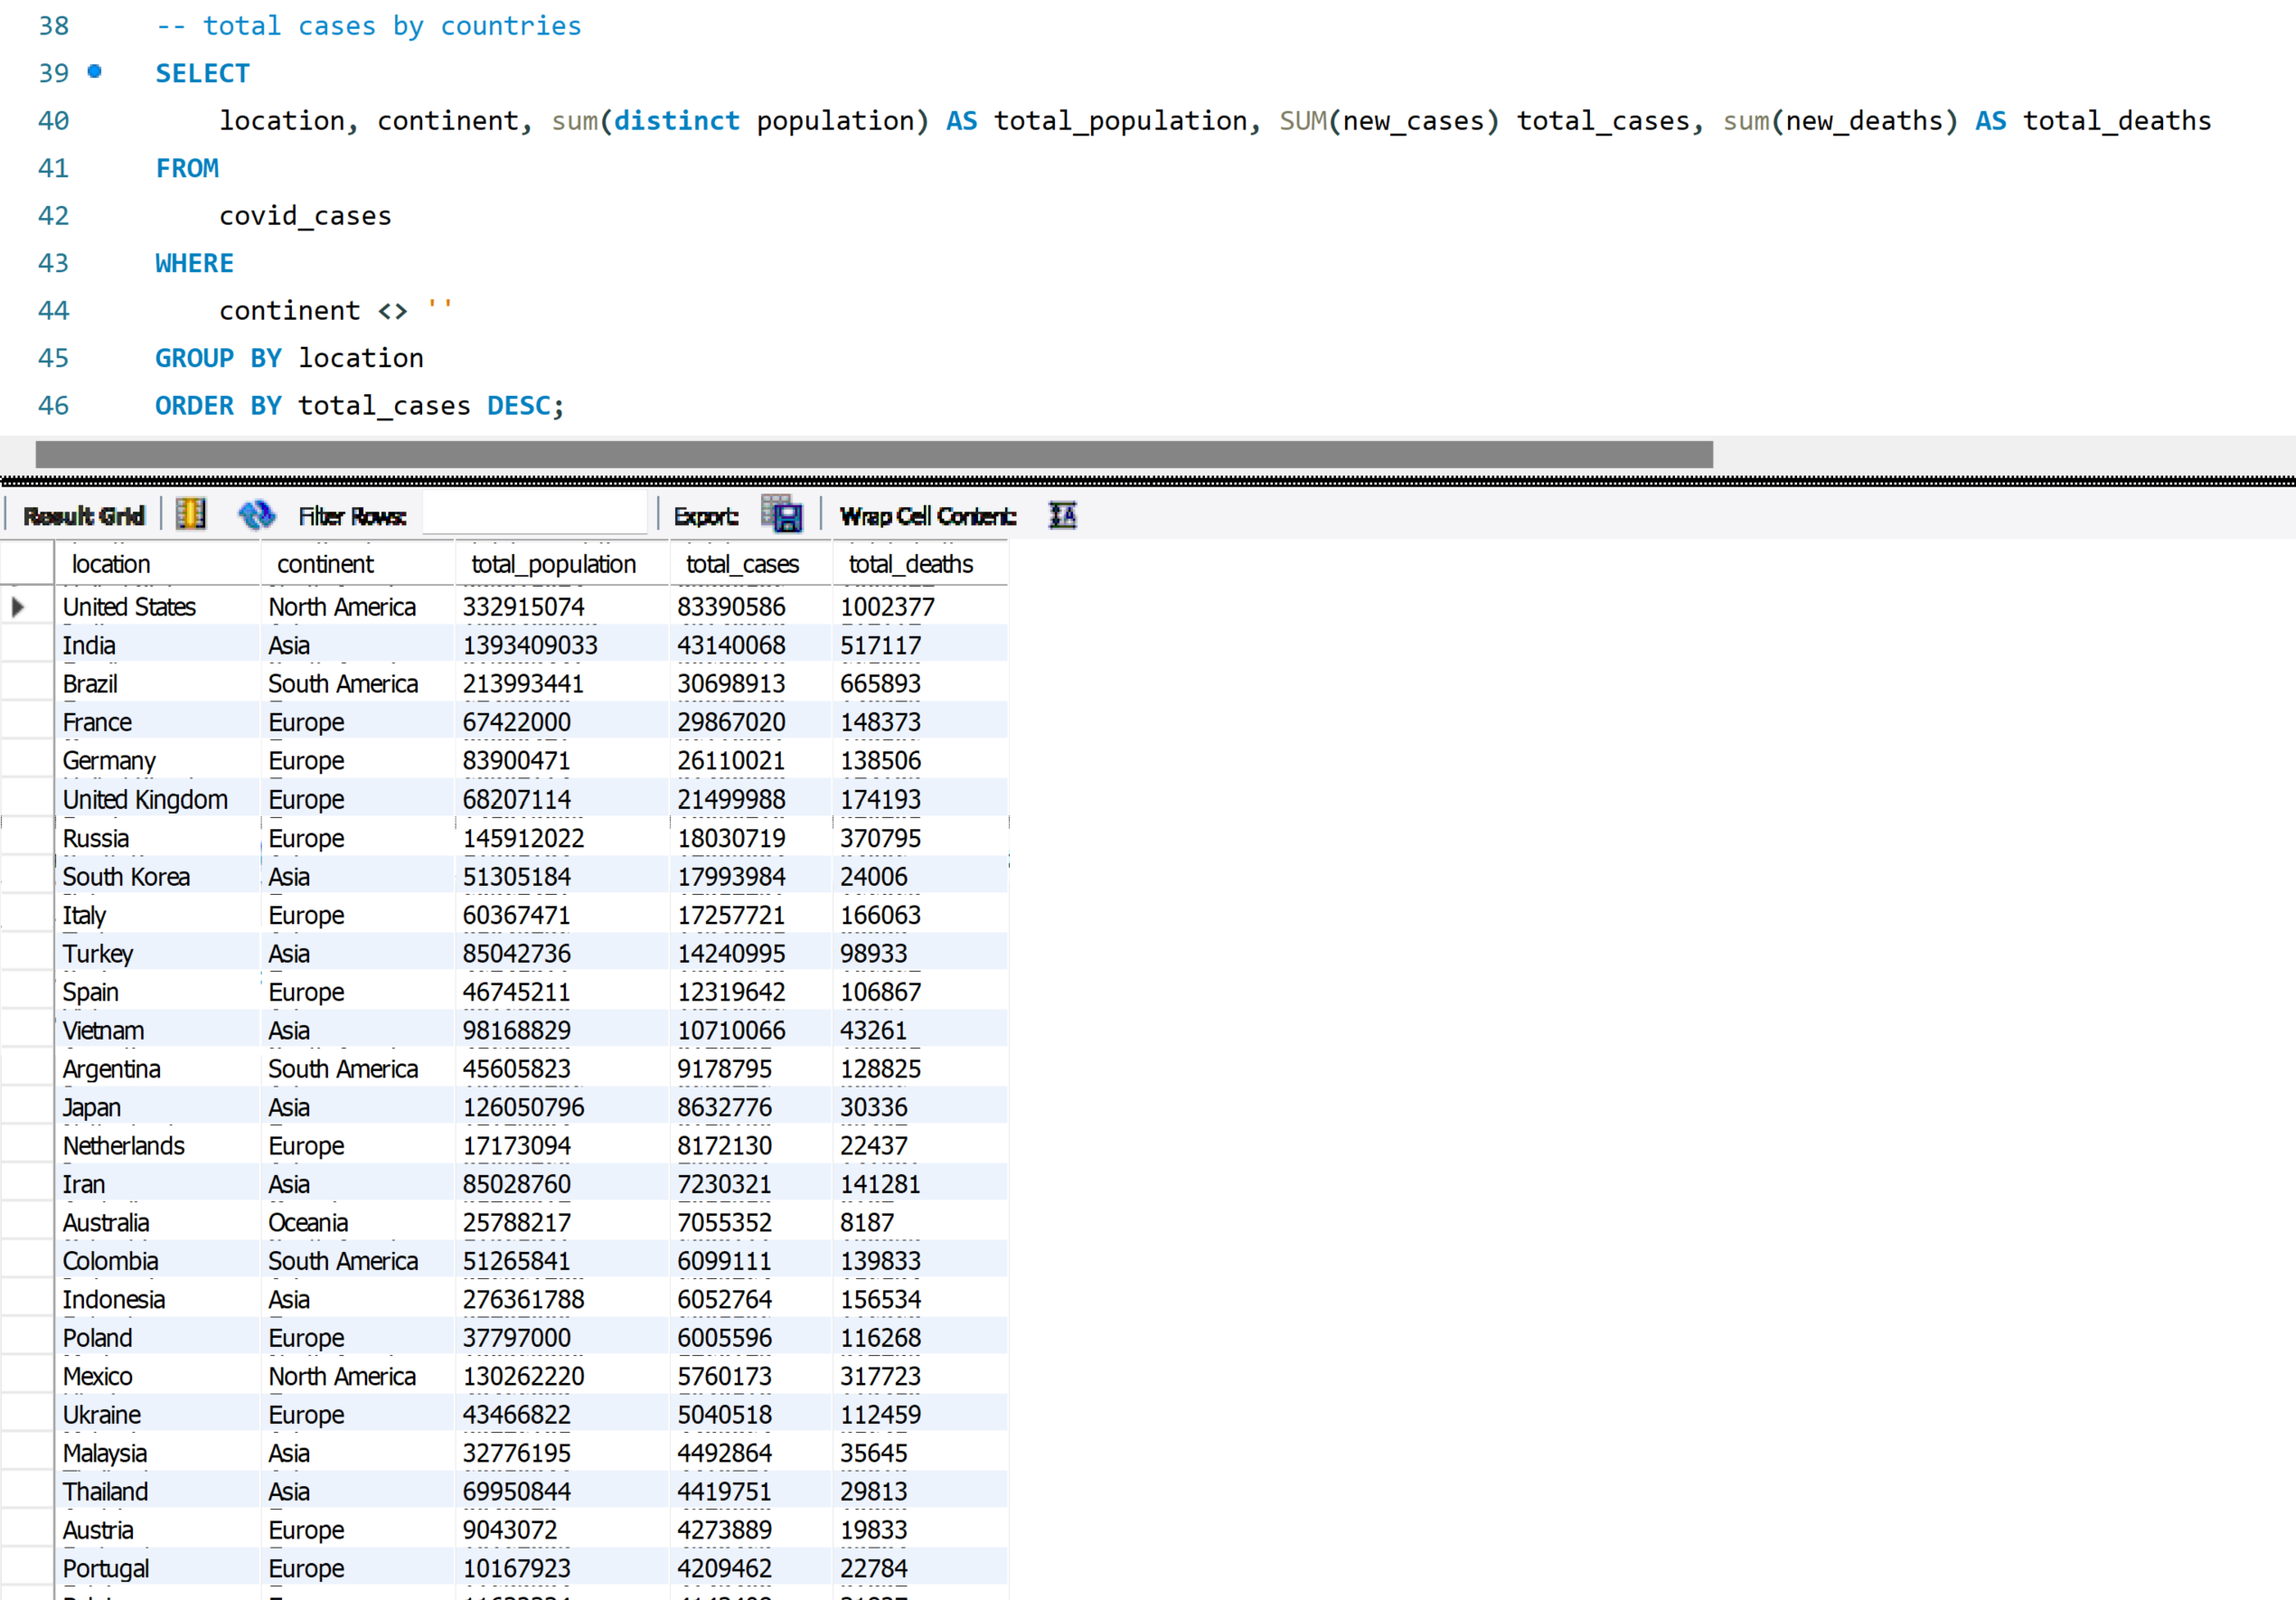
Next I want to look at the confirmed cases by countries. And I was shocked by how much more cases and deaths the United States have over the second place India, nearly doubled!
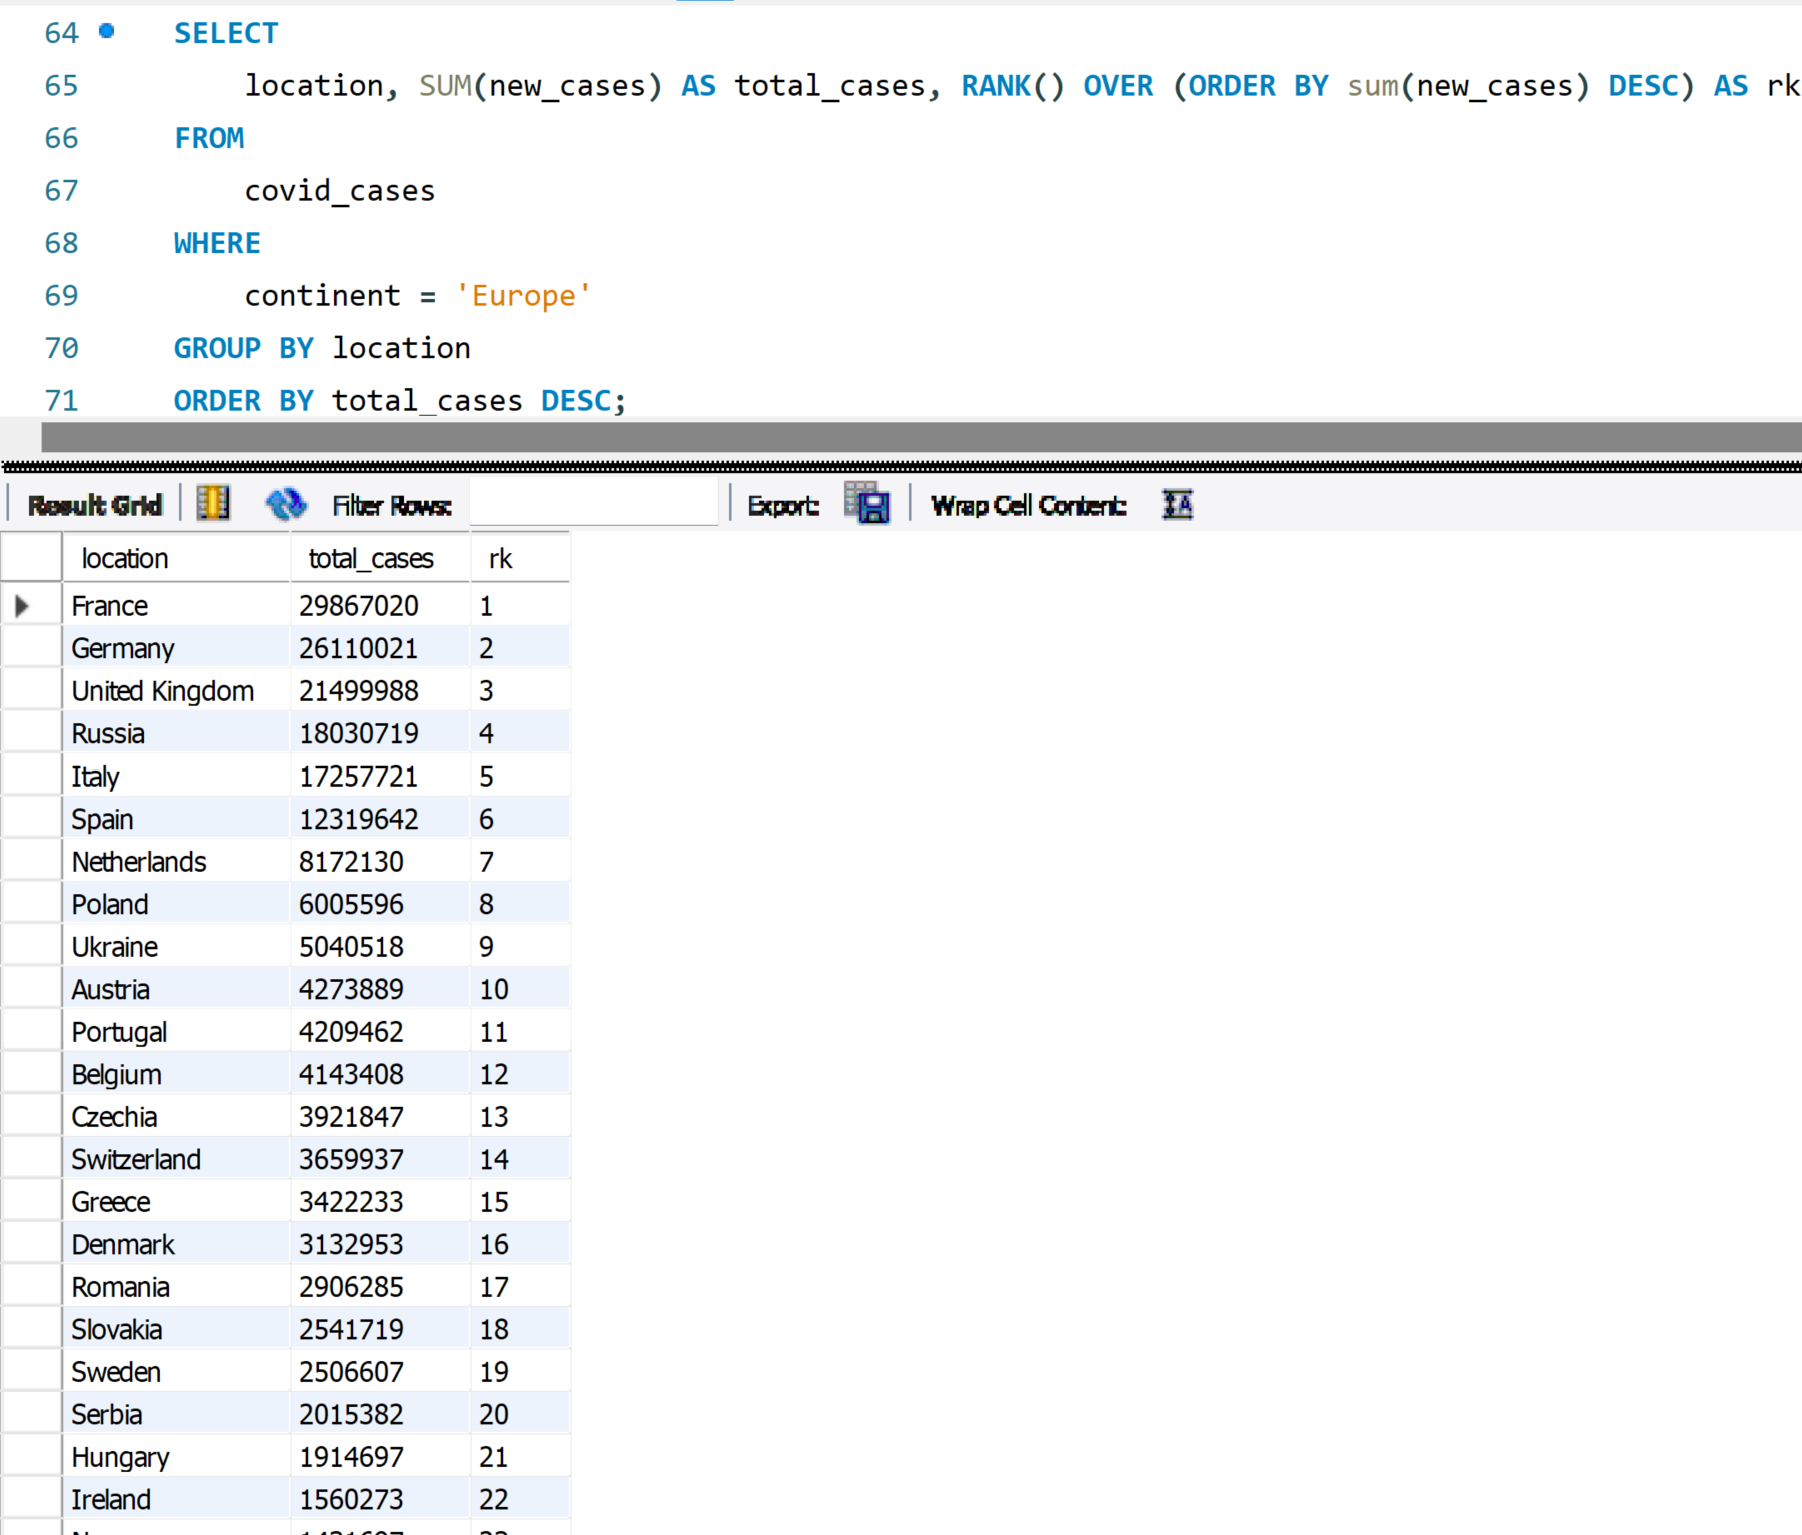
I am taking a look at the numbers between continents, Europe has the 3rd most population but it ranked both the 1st place in confirmed cases and death numbers.
![]()
Let’s drill down in the European countries
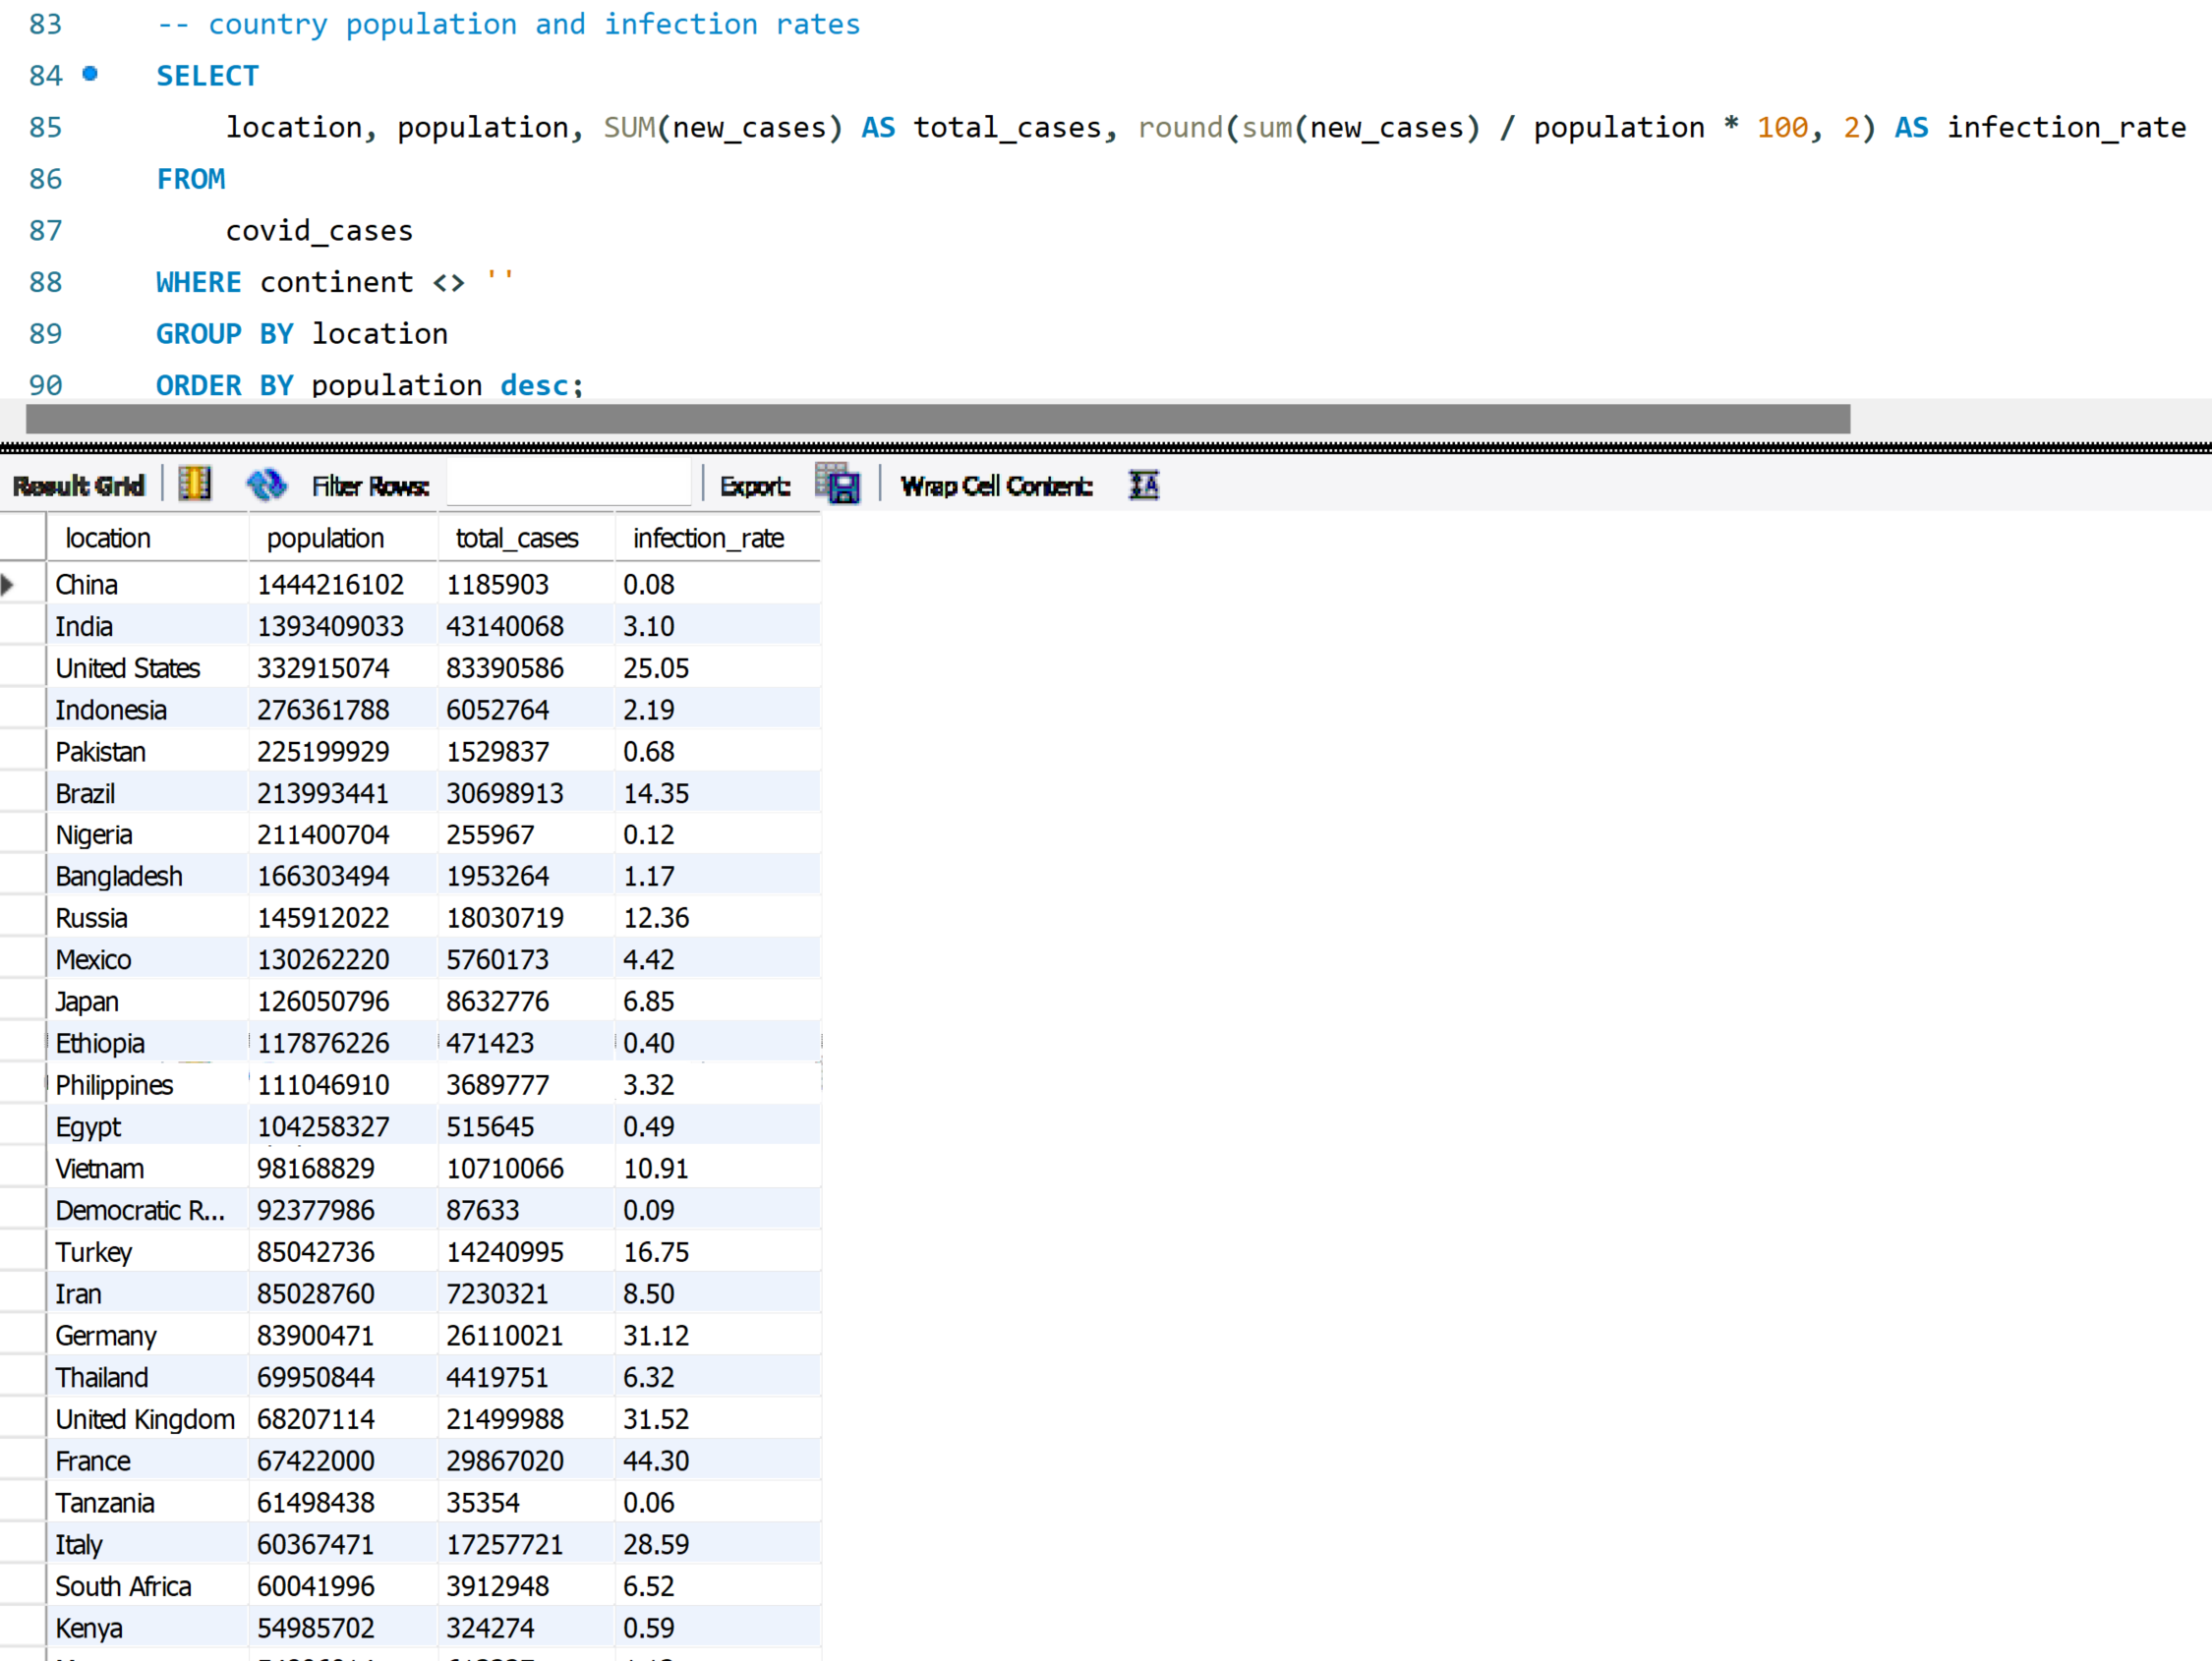
Is the country with larger population also has higher infection rate? The answer is no, in the matter of fact, China has a surprising low rate.
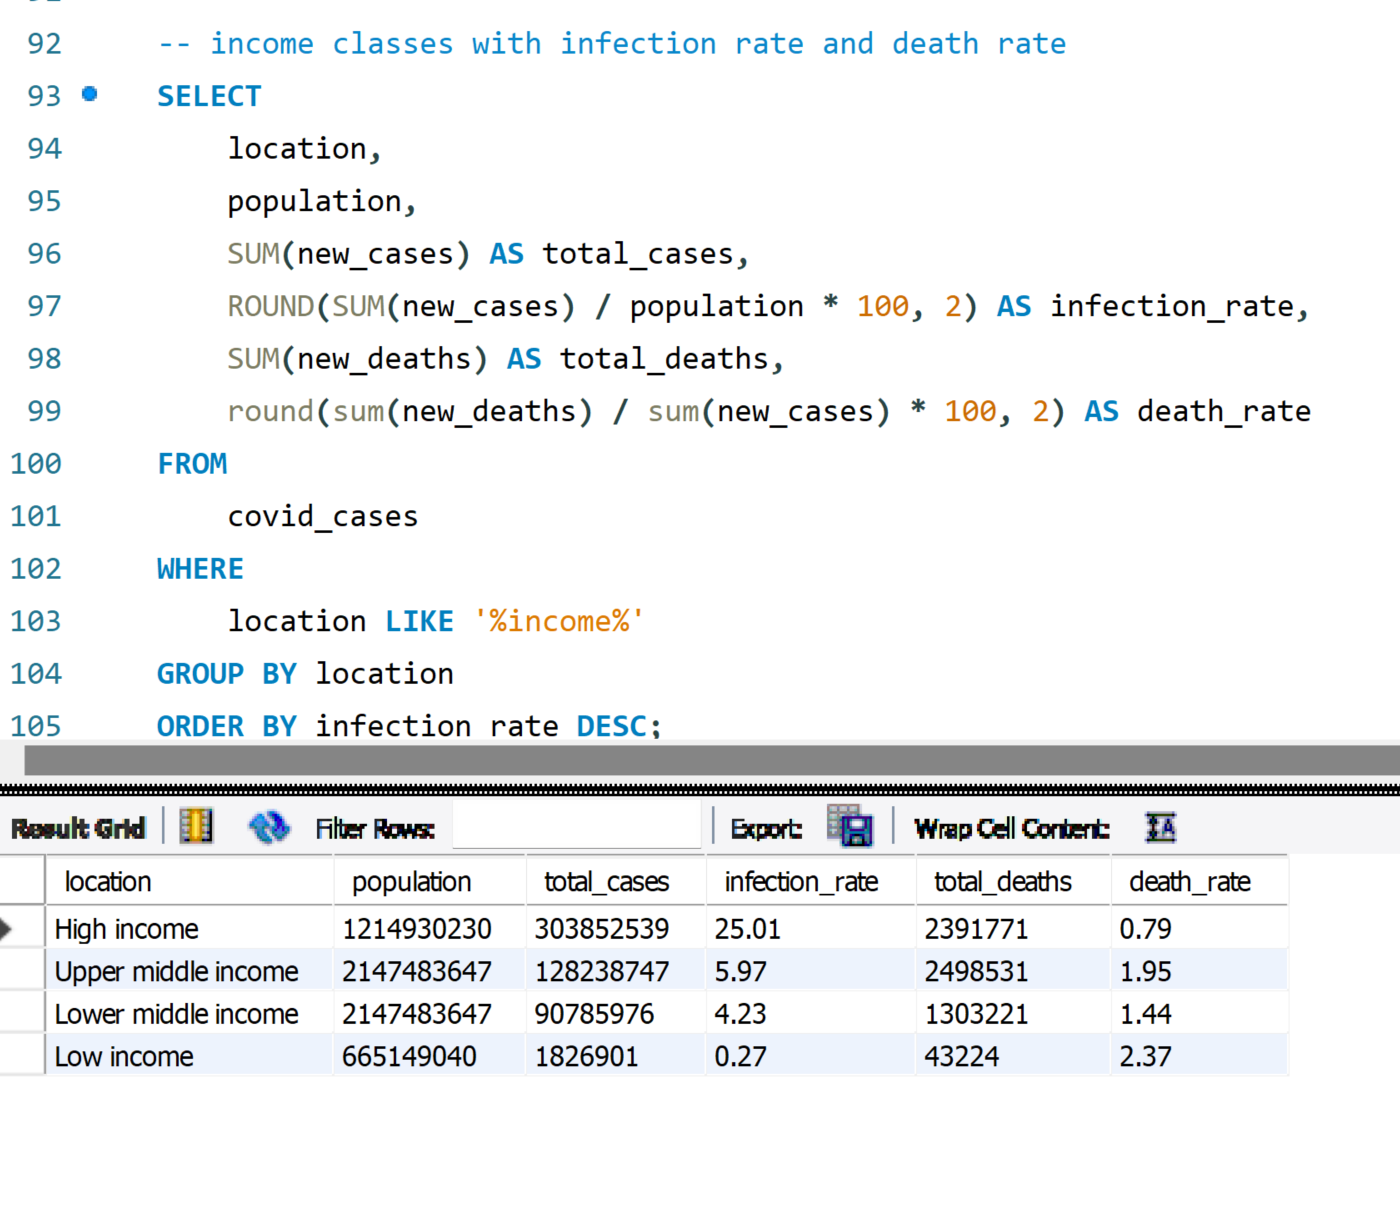
There is a income category, as we can see from the results below, high income group has the highest infection rate, but the infection fatality rate is the lowest in the groups, perhaps they have better access to treatments, I will need to find more data to look into.
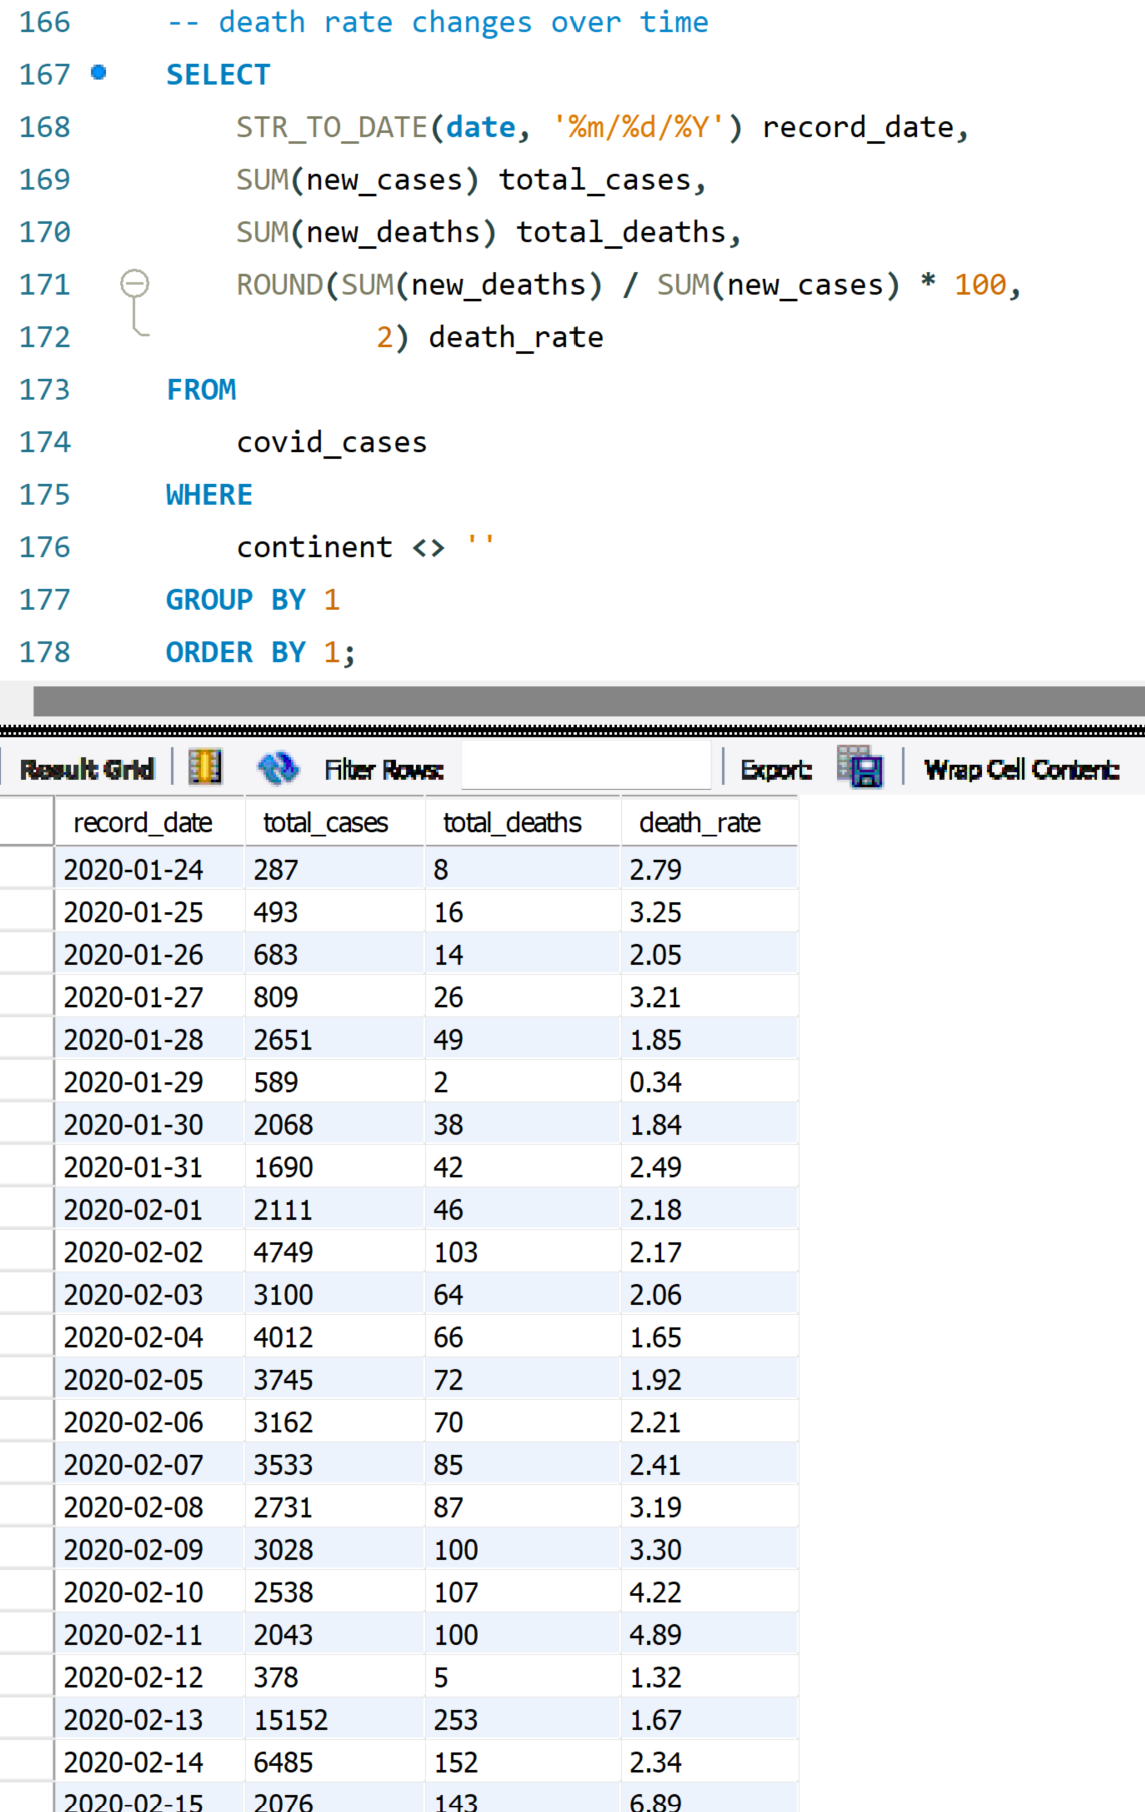
I want to look at how the numbers change globally over time, I will visual this using Tableau later.
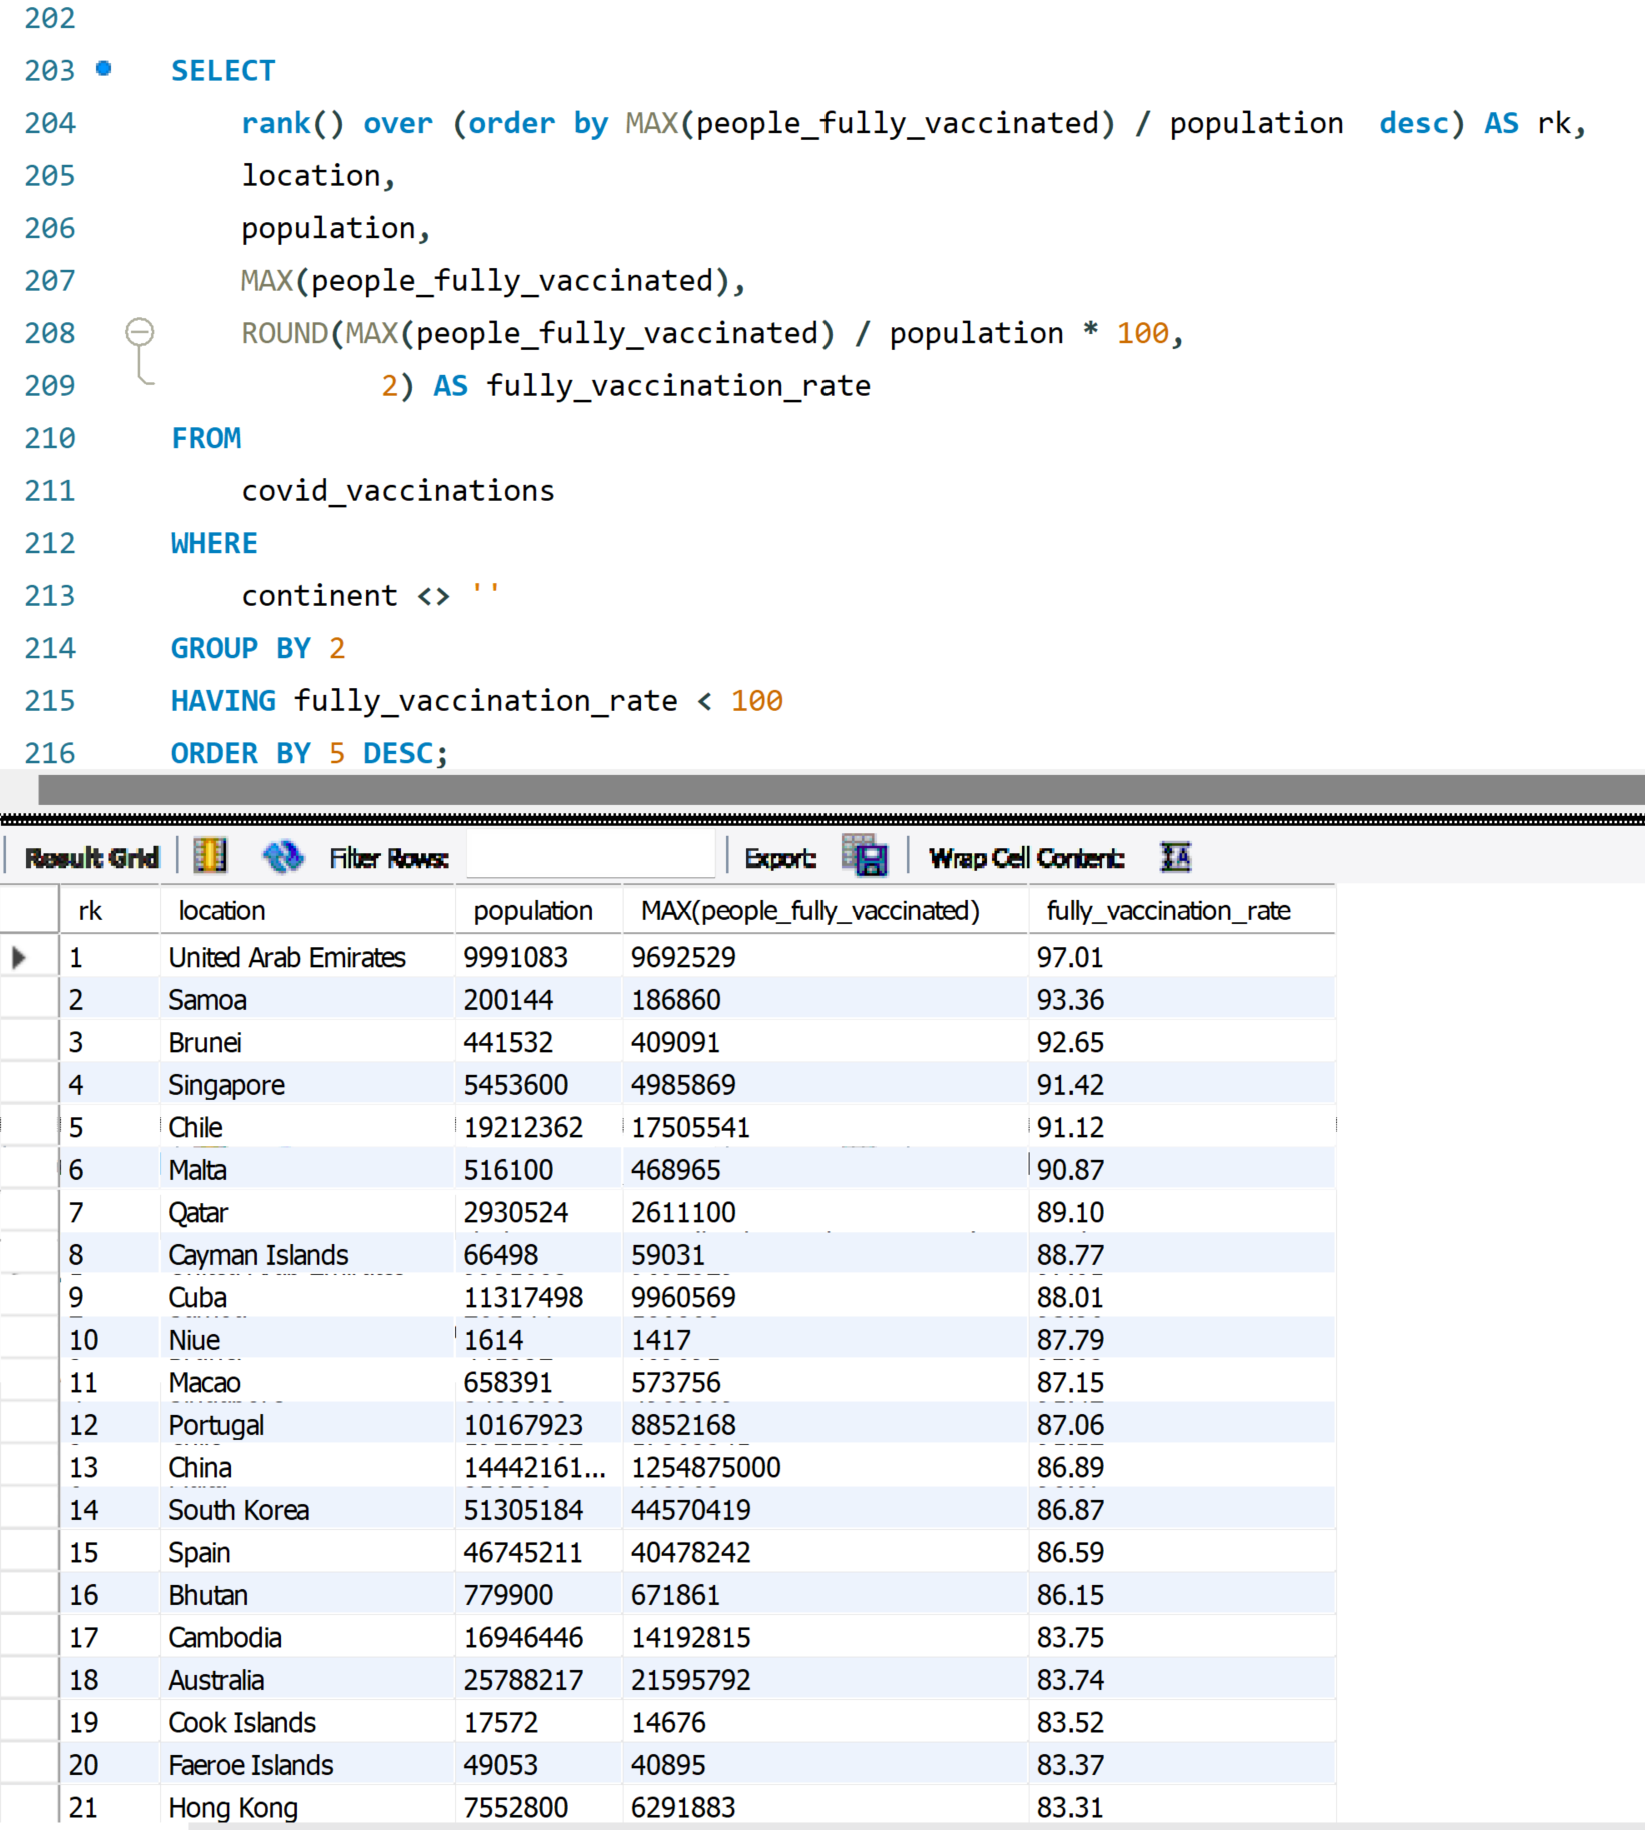
I also want to see the vaccination rates in countries
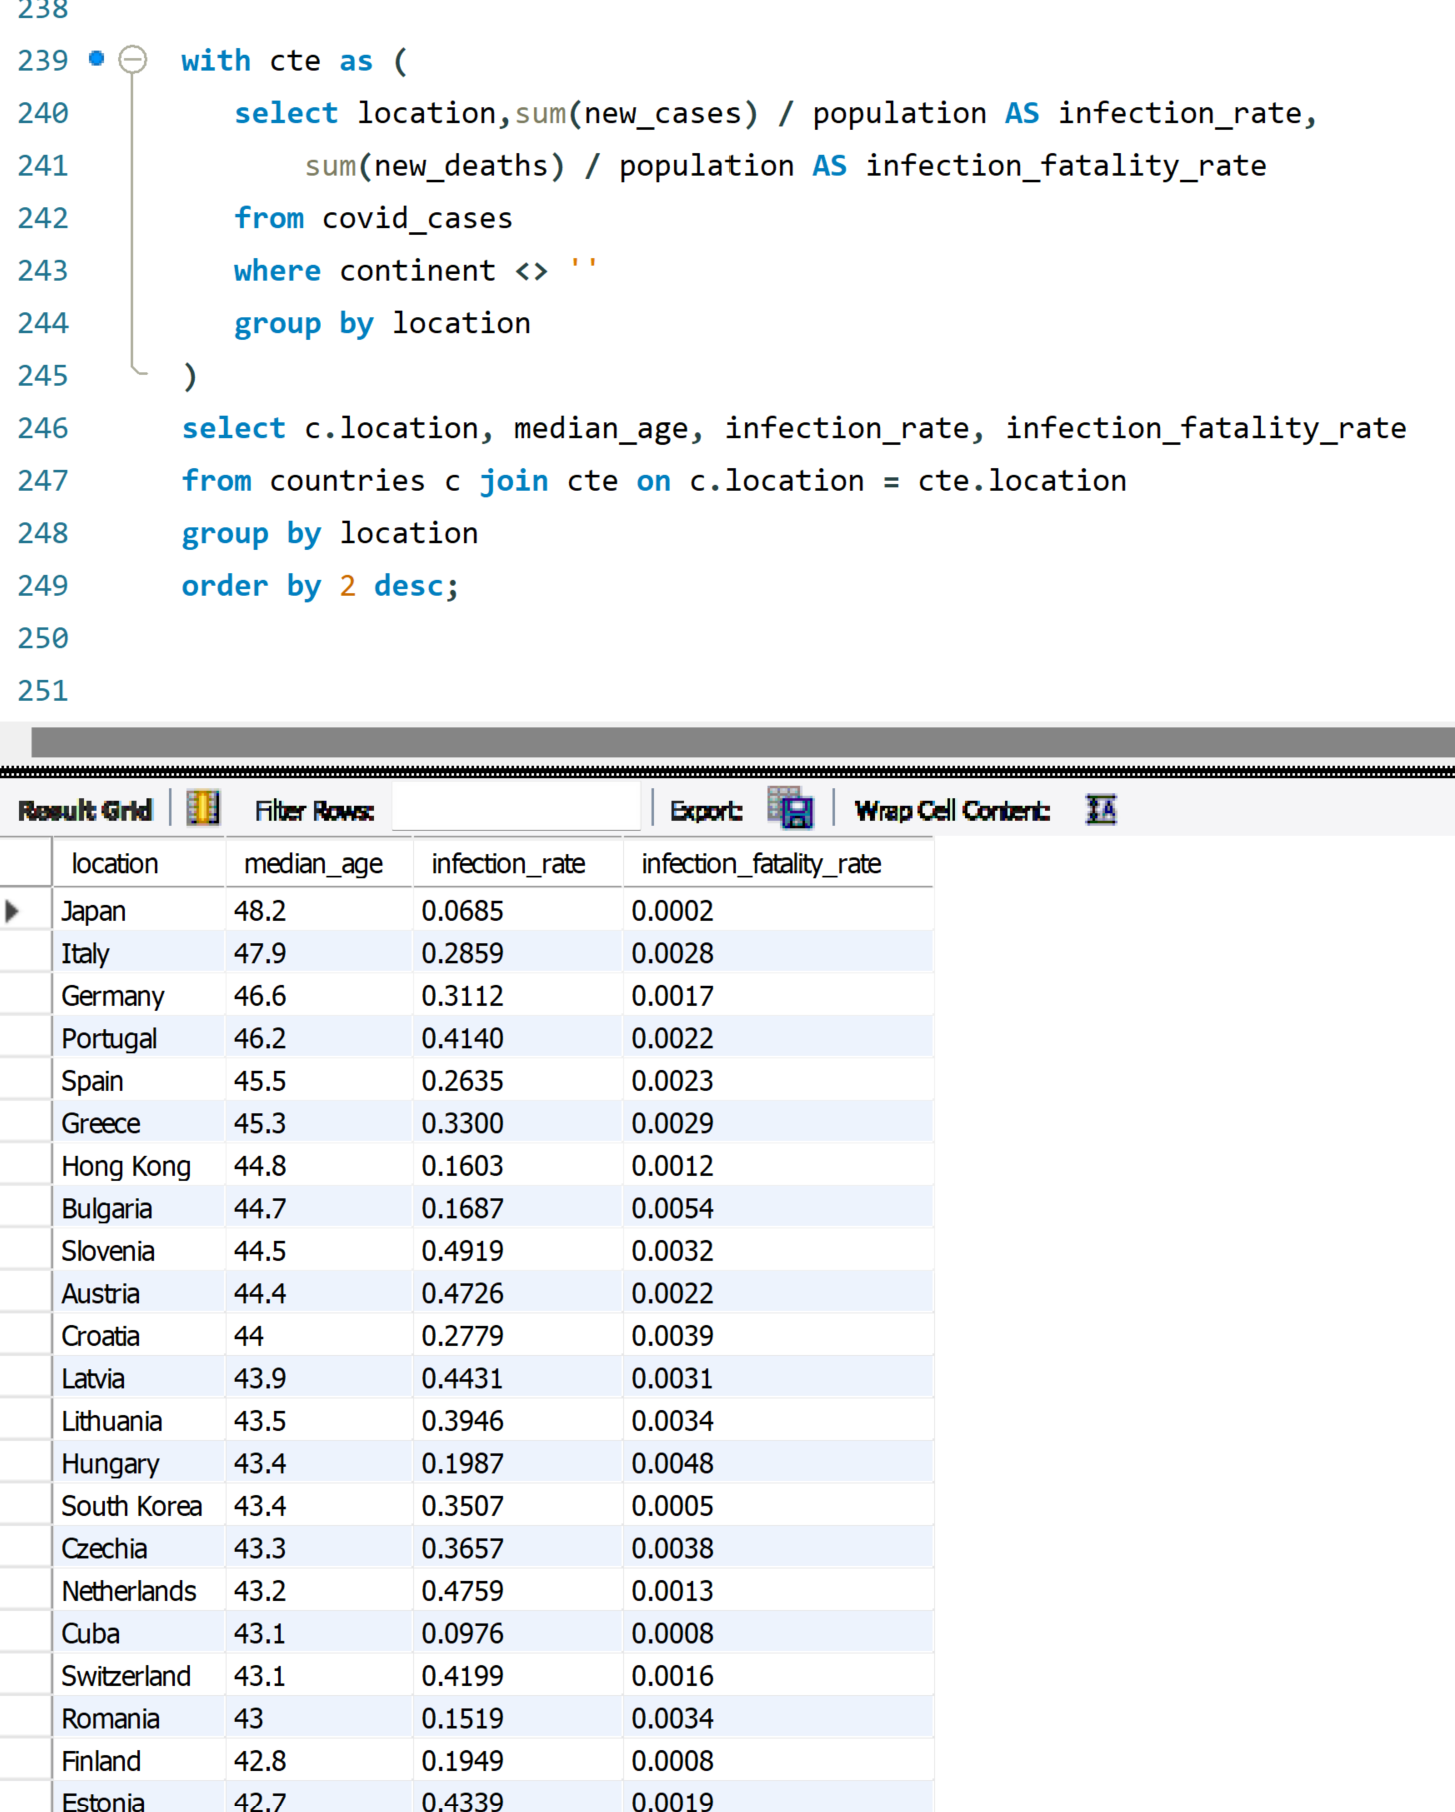
What are the relationship between age and infection also death rate? I will get the data and look at it in Tableau.
Now let’s add the data sources to Tableau to get a better understanding on the data.
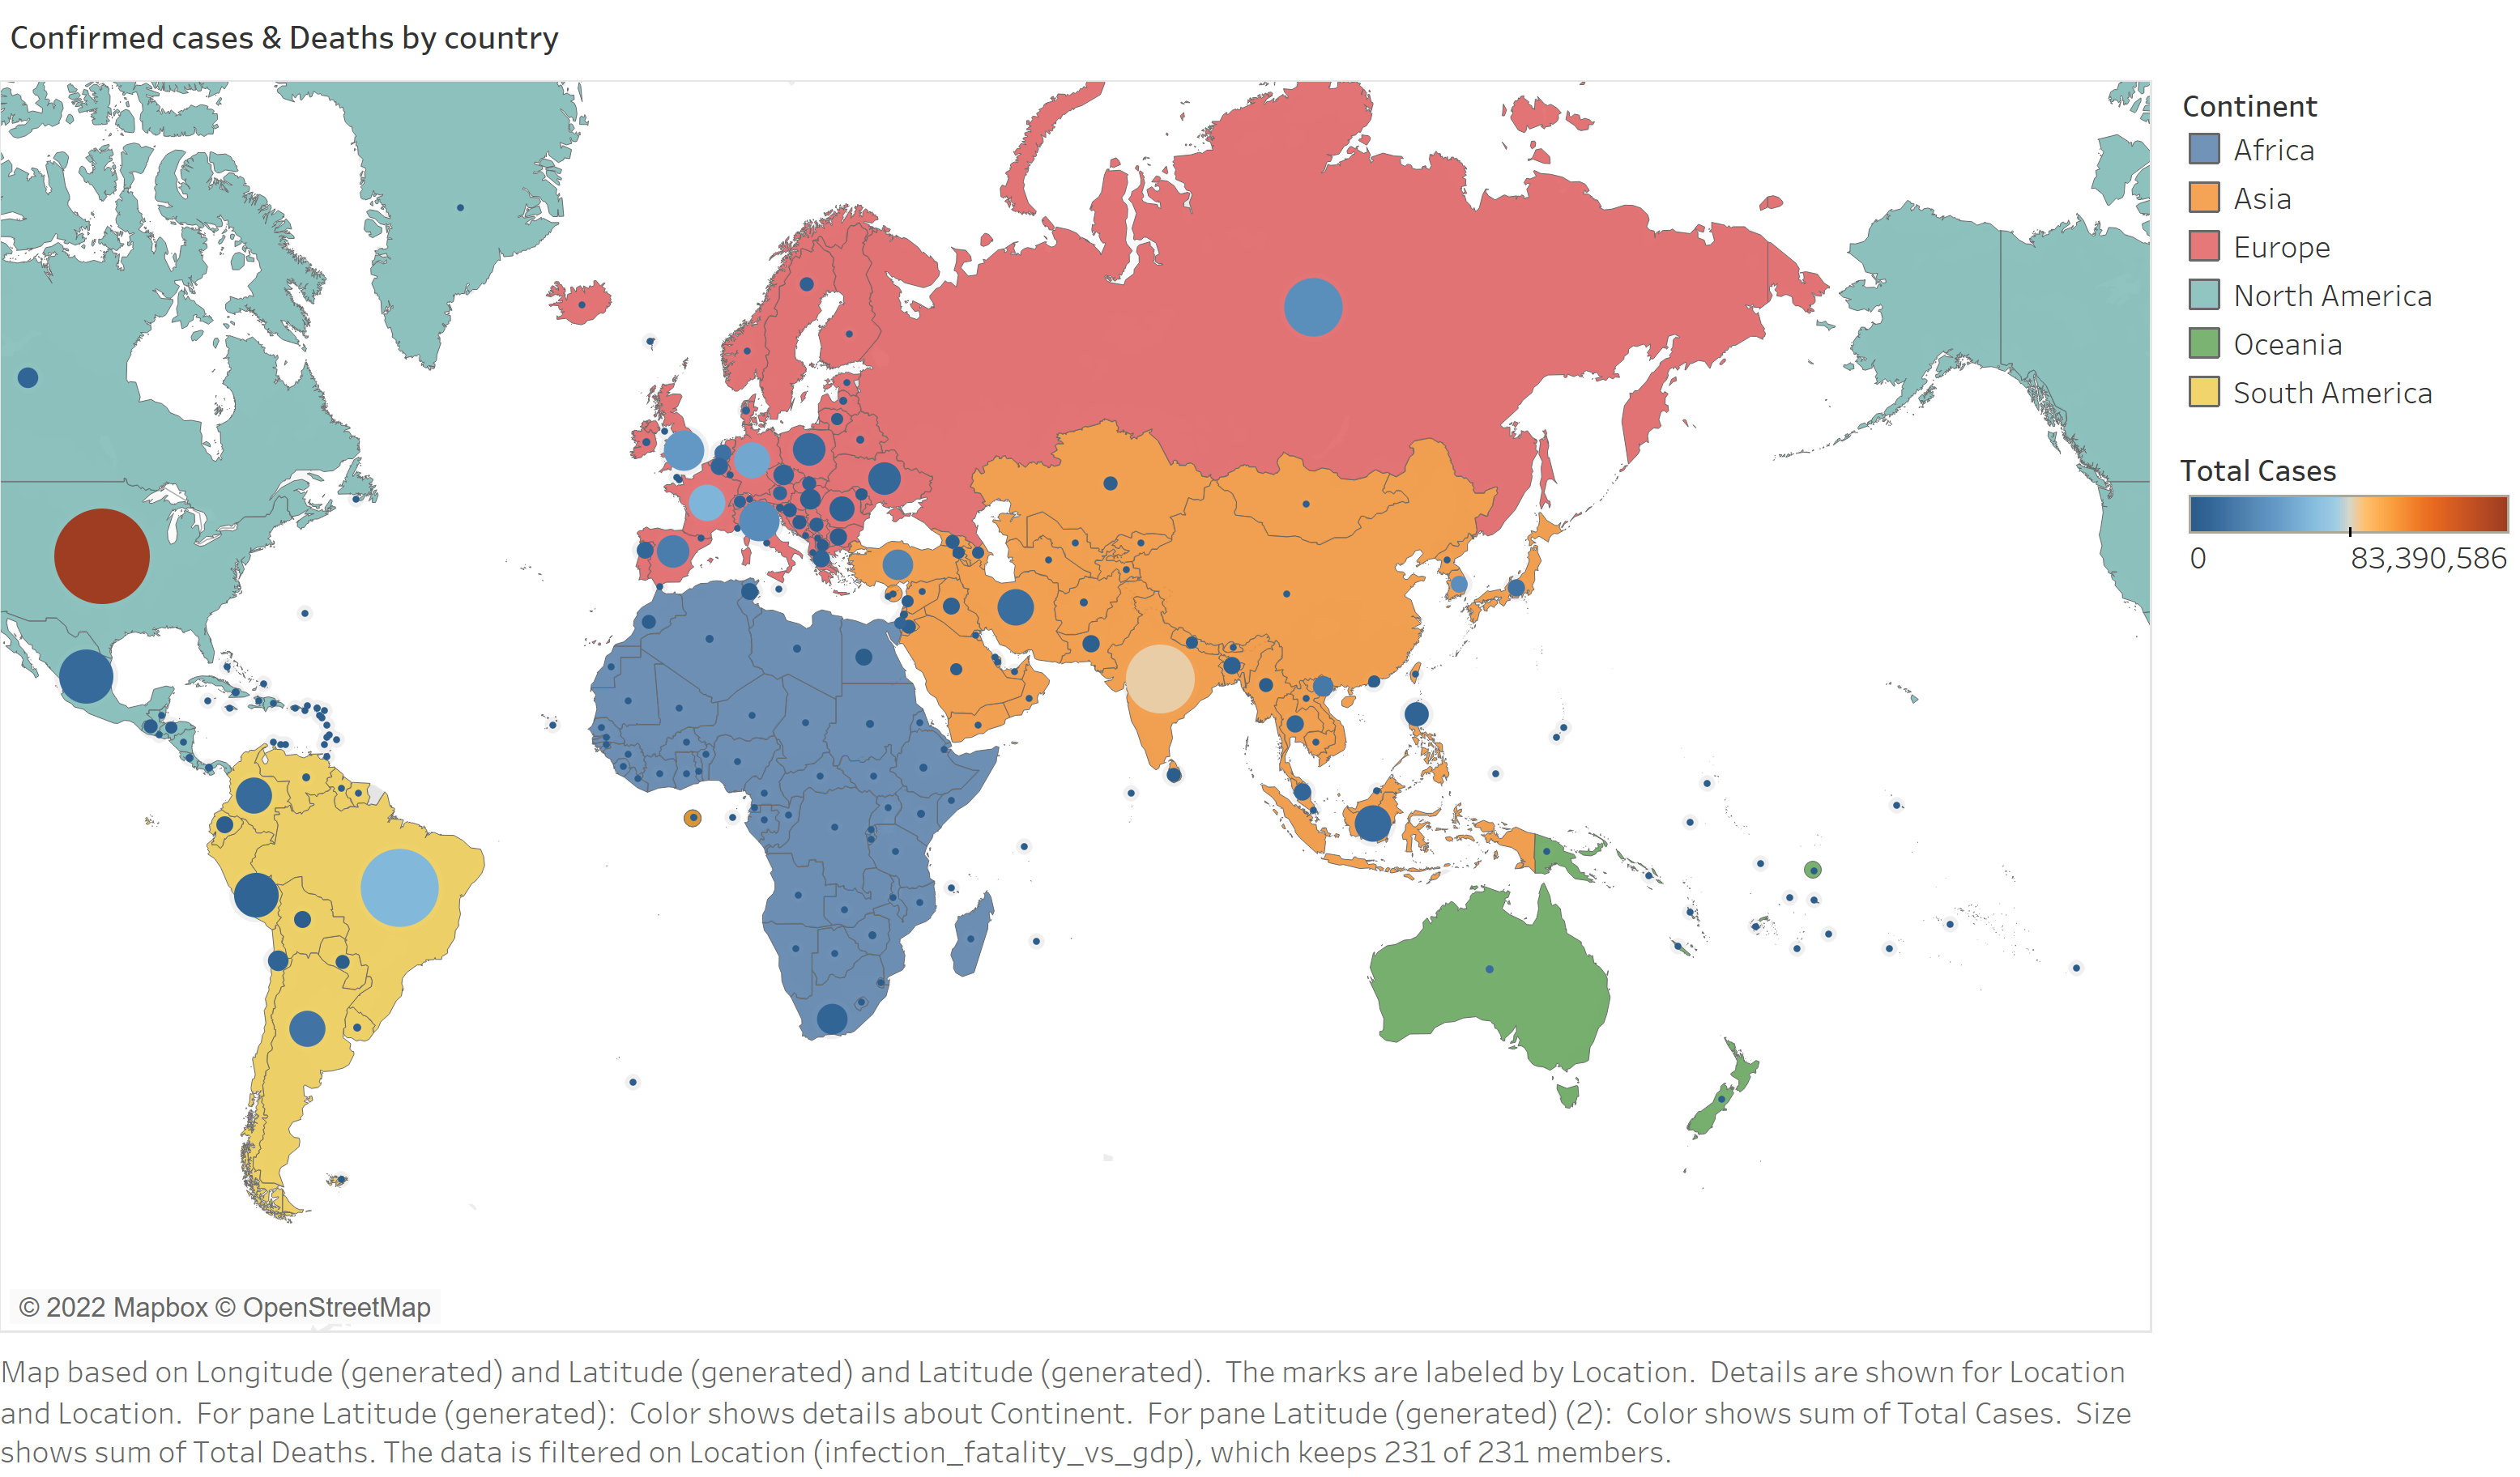
From the chart below, we can confirm thru the color depth and the circle size, the United States, India, Russia, Mexico and Brazil are the countries leading in confirmed cases and numbers of deaths.
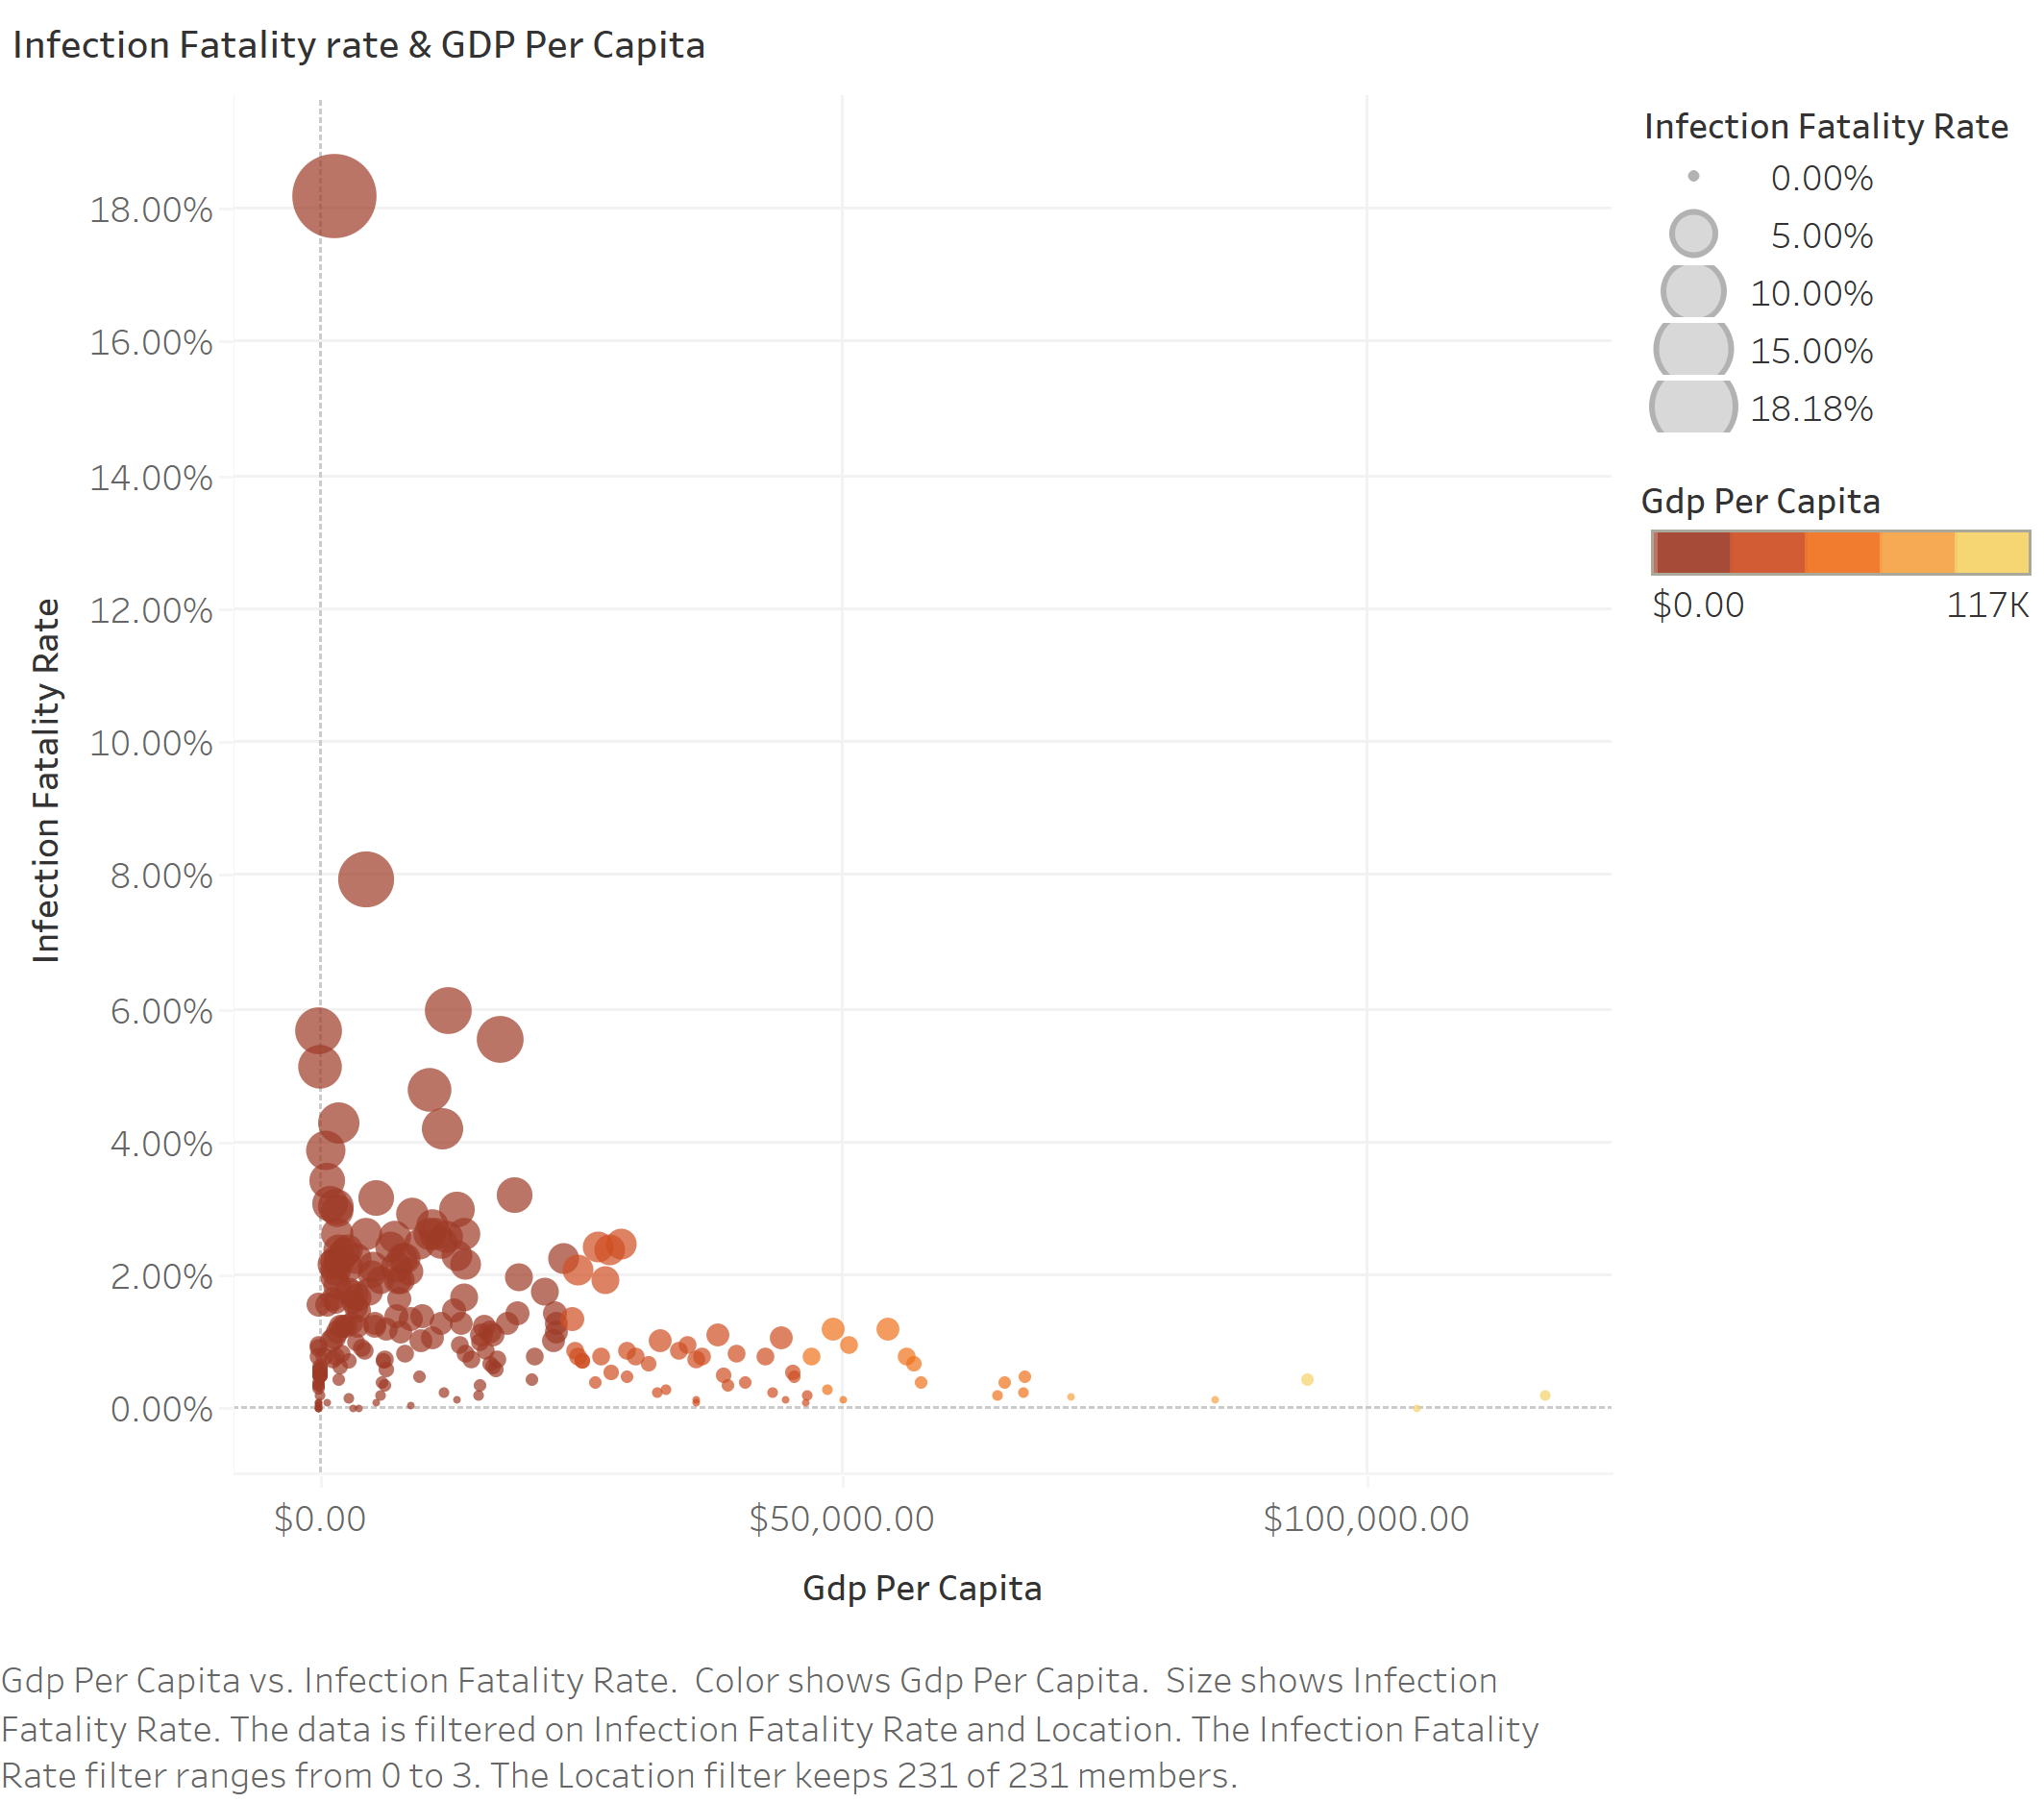
And the chart below also confirmed that the countries have higher GDP Per Capita, the lower the infection fatality rate, because of the better health care system.
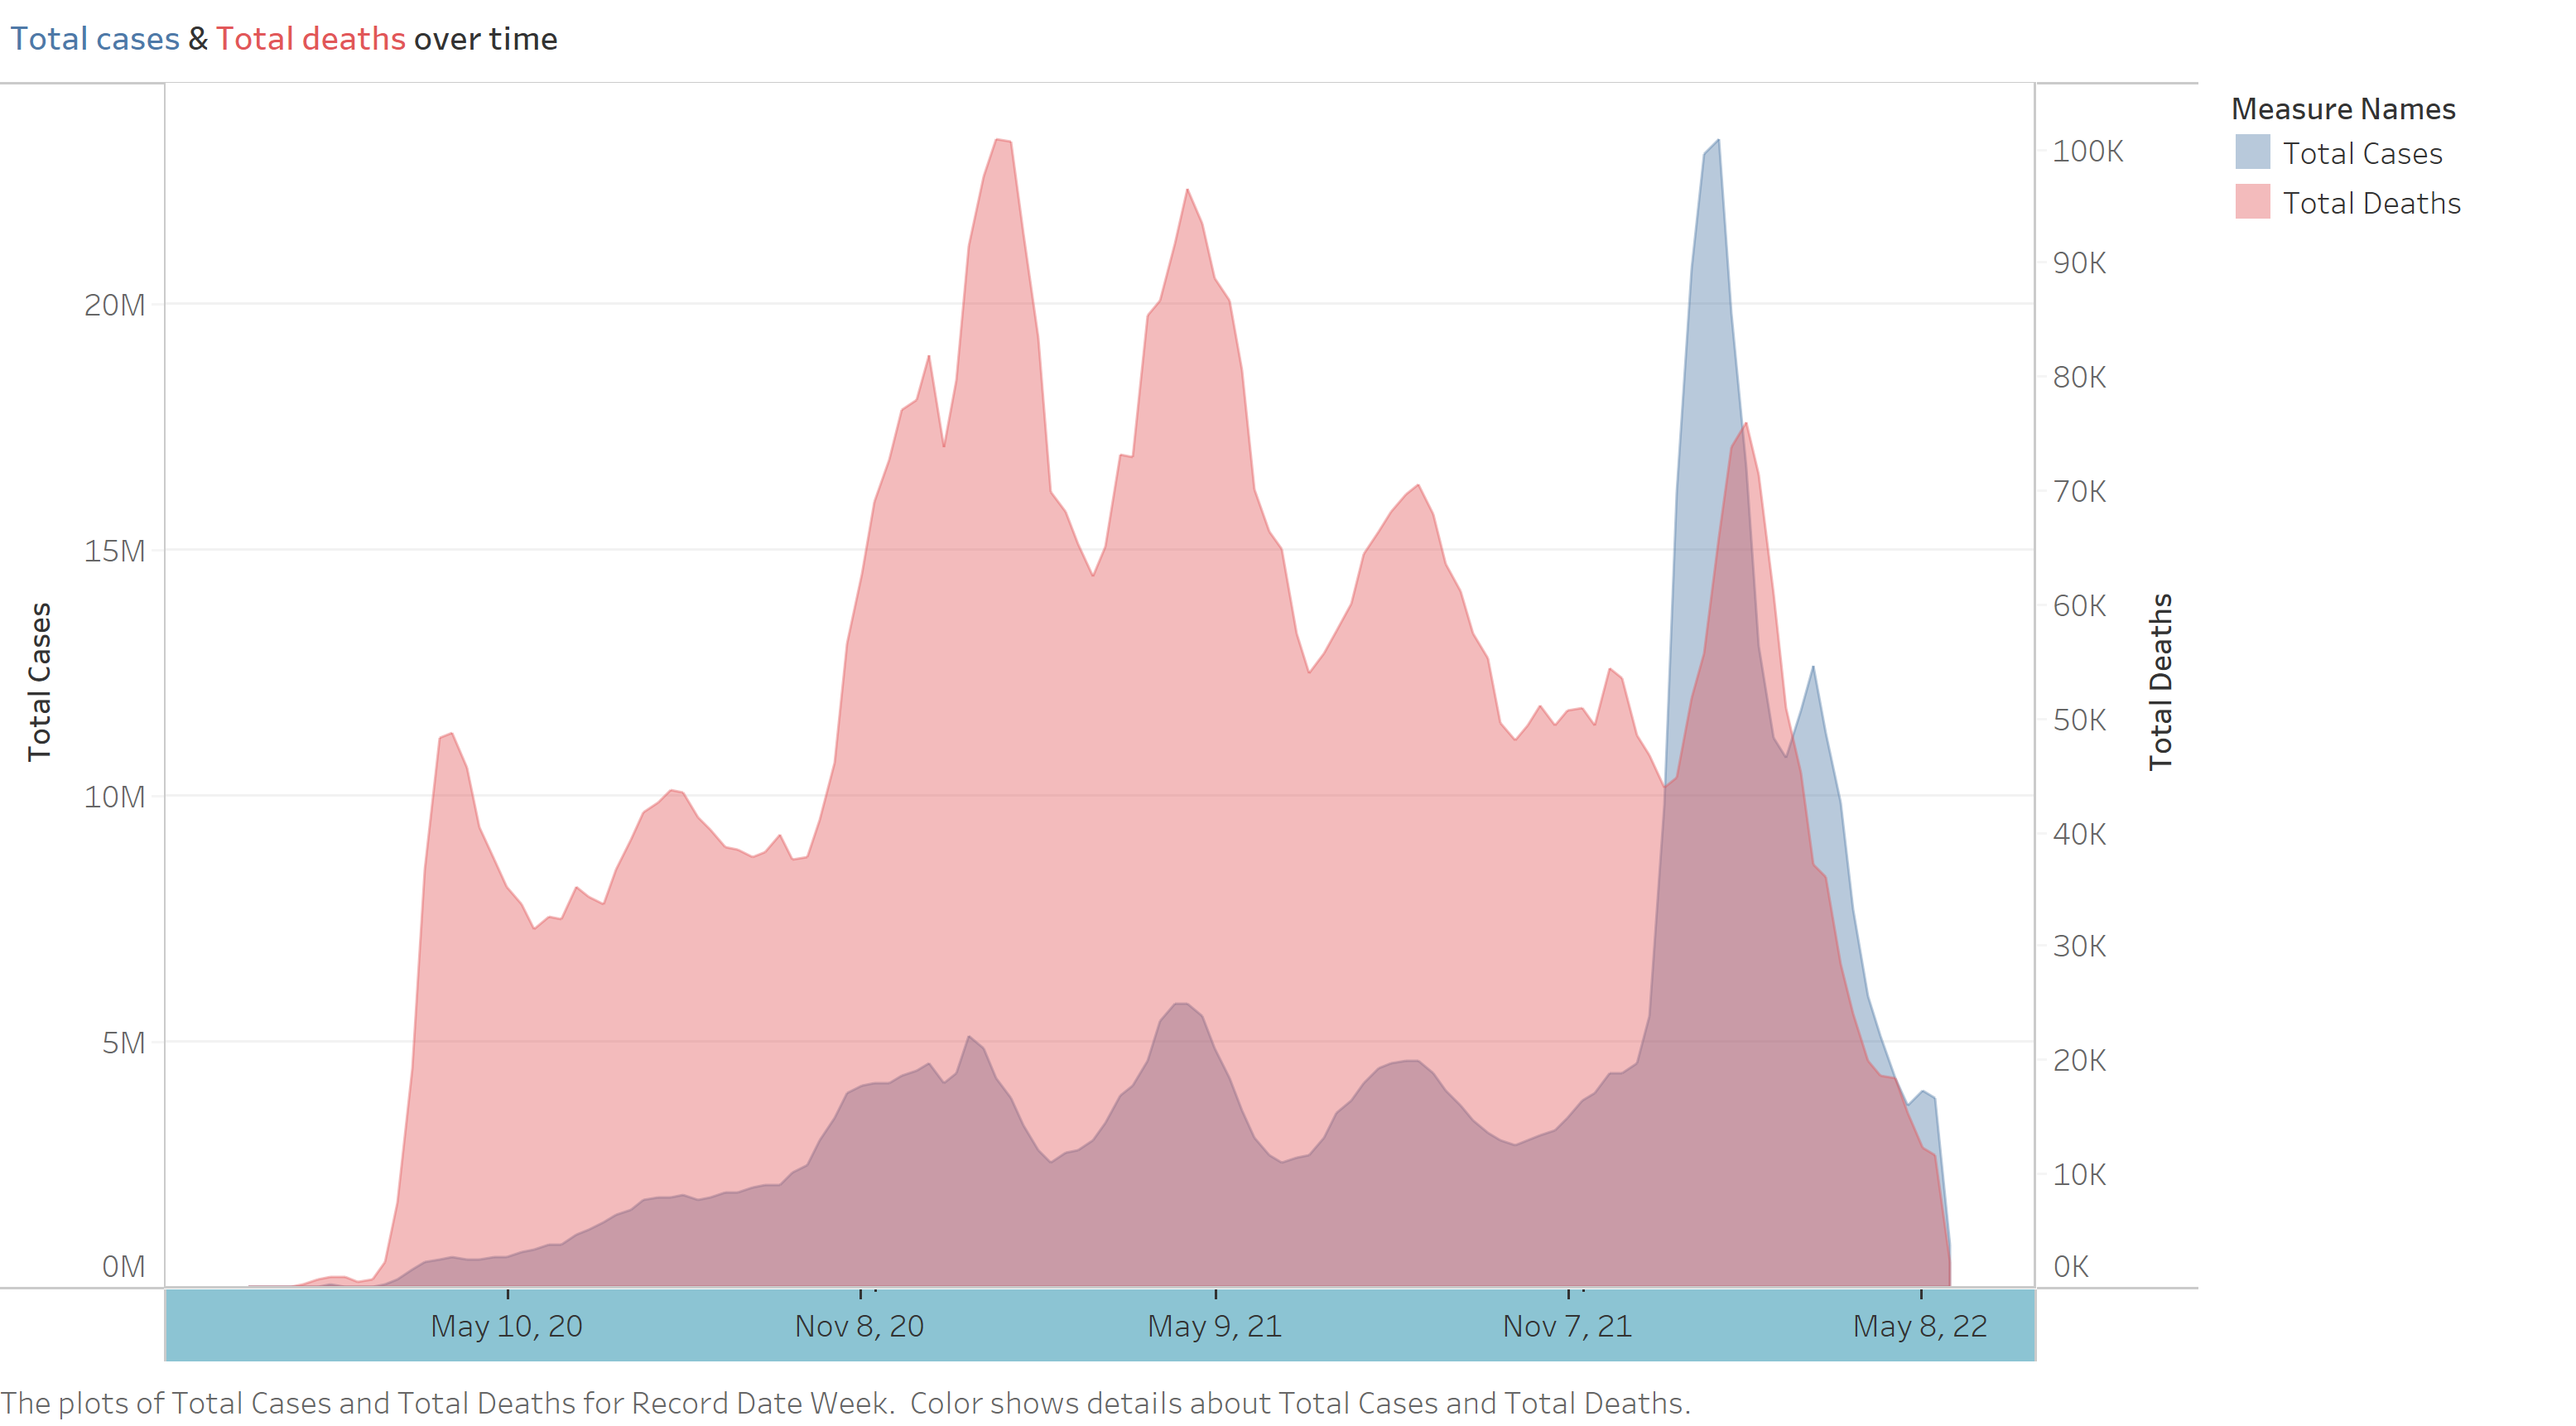
After comparing the trends for both infection rate and infection fatality rate using the chart below, the numbers are going towards the lowest points, which is a great sign.
By looking at the chart below, the younger the age, the lower the infection rate, young people seems has the better immunity against the virus.

I also put up an interactive dashboard on Tableau Public, any feedback would be greatly appreciated.